Function
Project Purpose:
The primary goal of our project is to create an engaging stock investor simulator designed to mimic real-world stock trading while providing a user-friendly experience. Our simulator includes several key features aimed at helping users monitor and manage their investments:
-
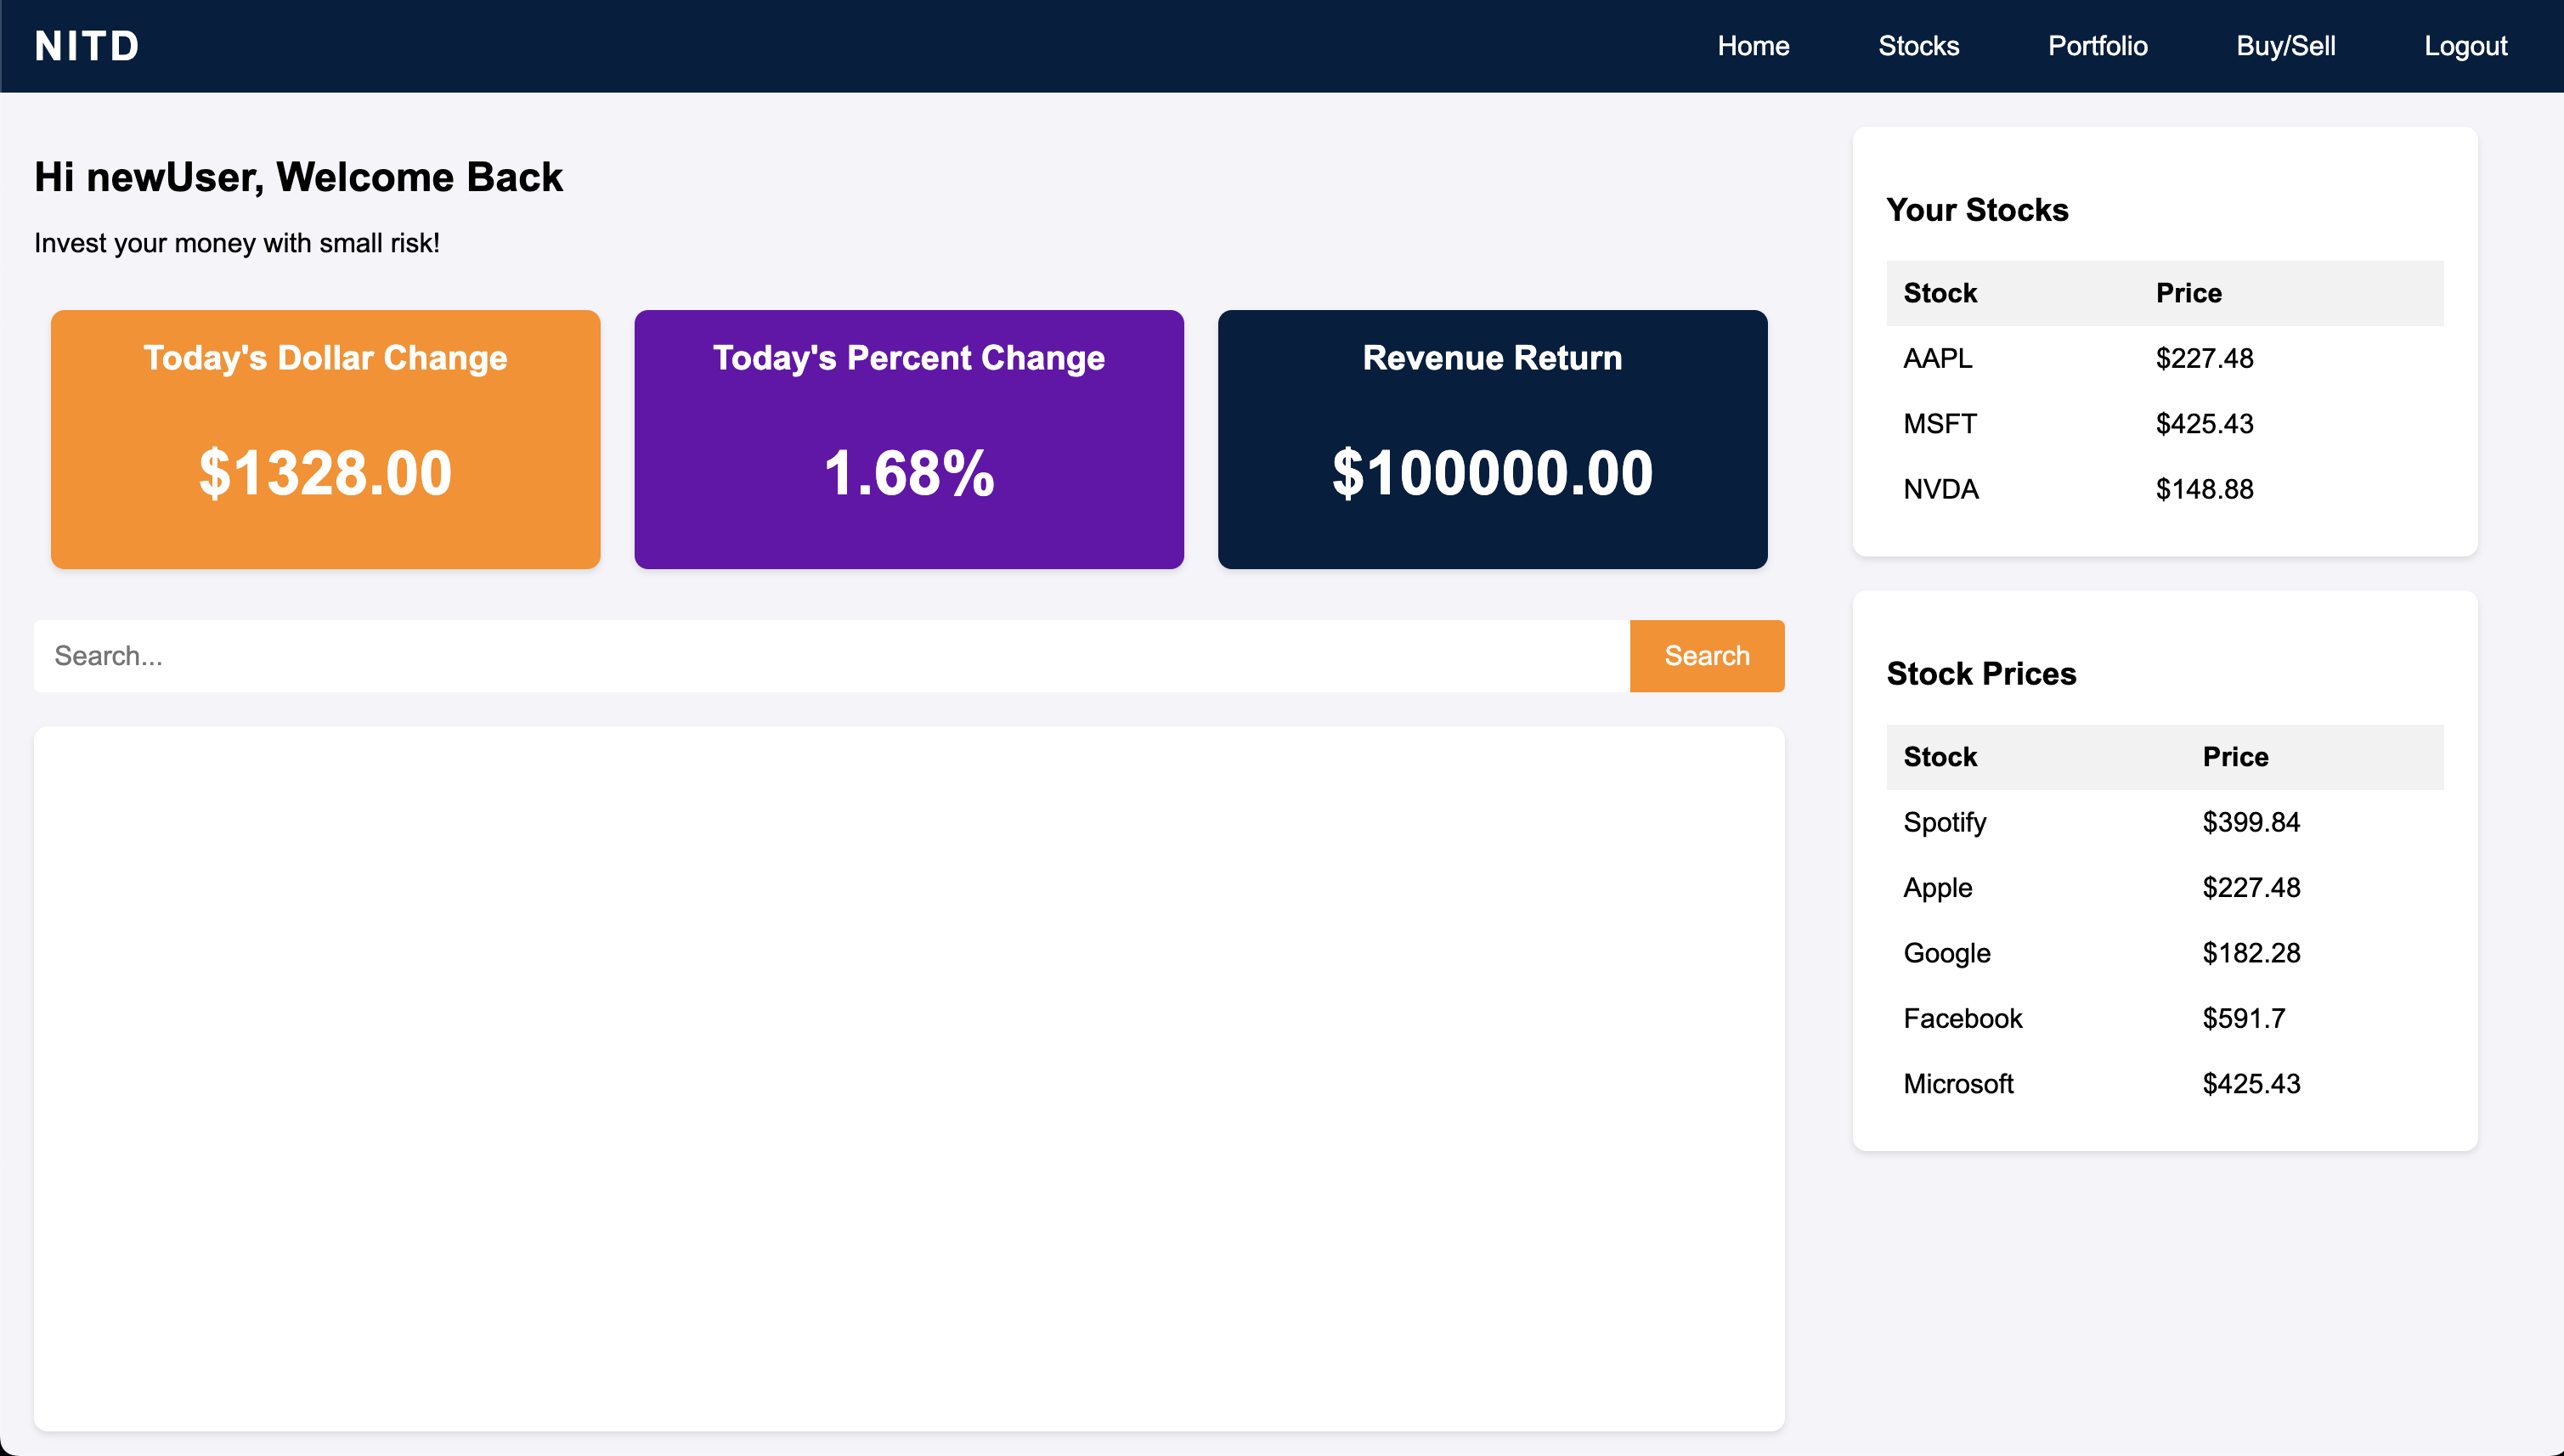
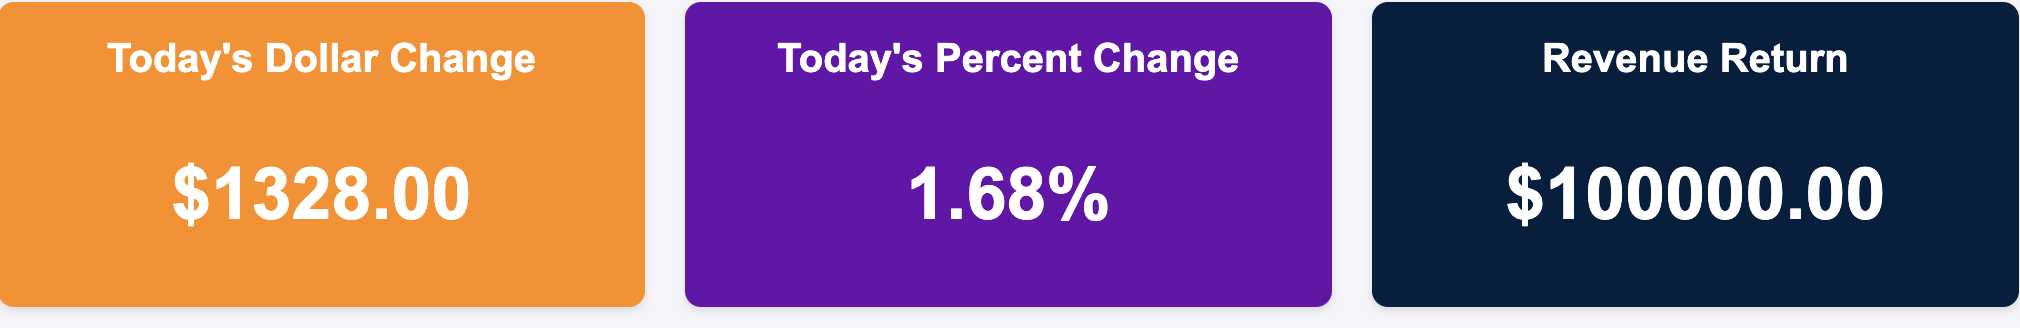
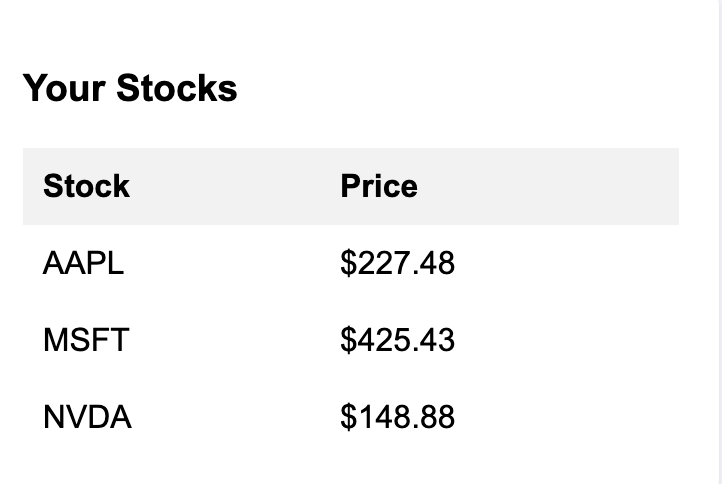
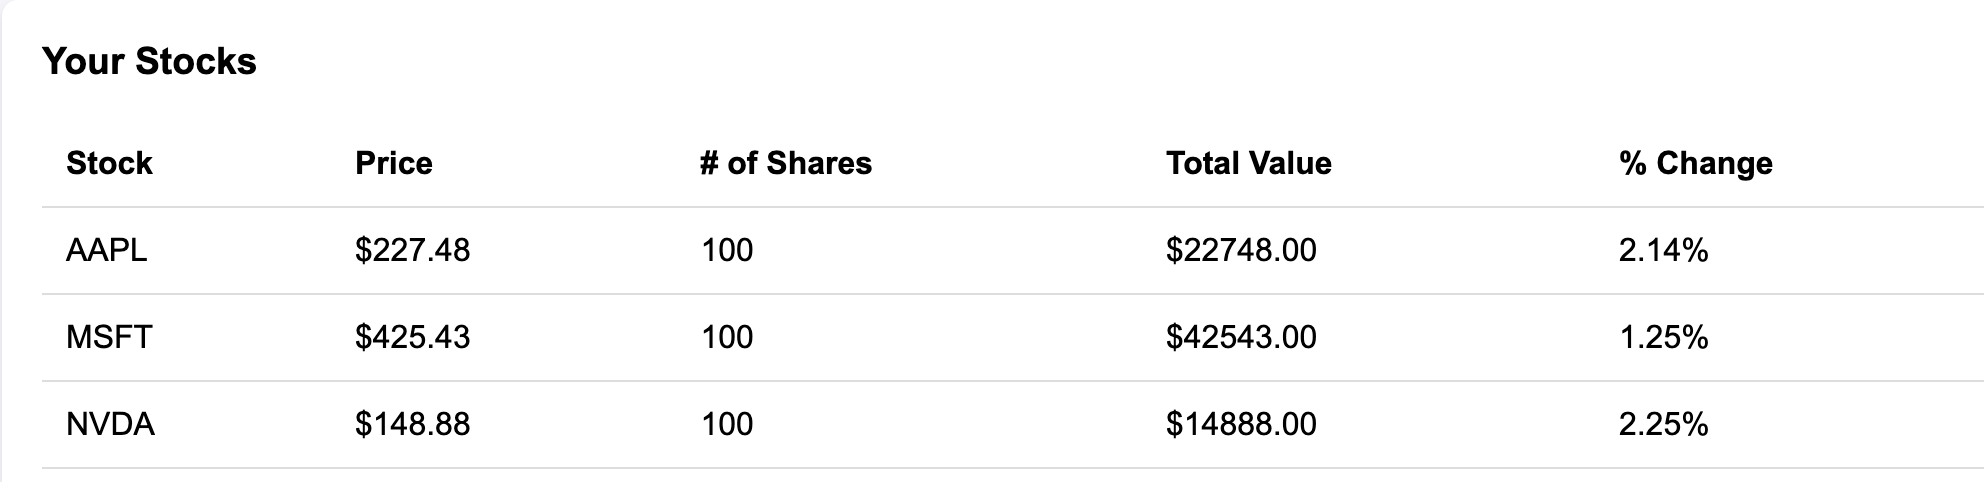
Home Page: Displays high-level information such as dollar gain, percent gain, and total value of the portfolio. Users can also view a dynamic list of the biggest stock movers and track all the stocks they are currently invested in.
-
Search Feature: Allows users to search for individual stocks by ticker symbol to easily find detailed information about their performance.
-
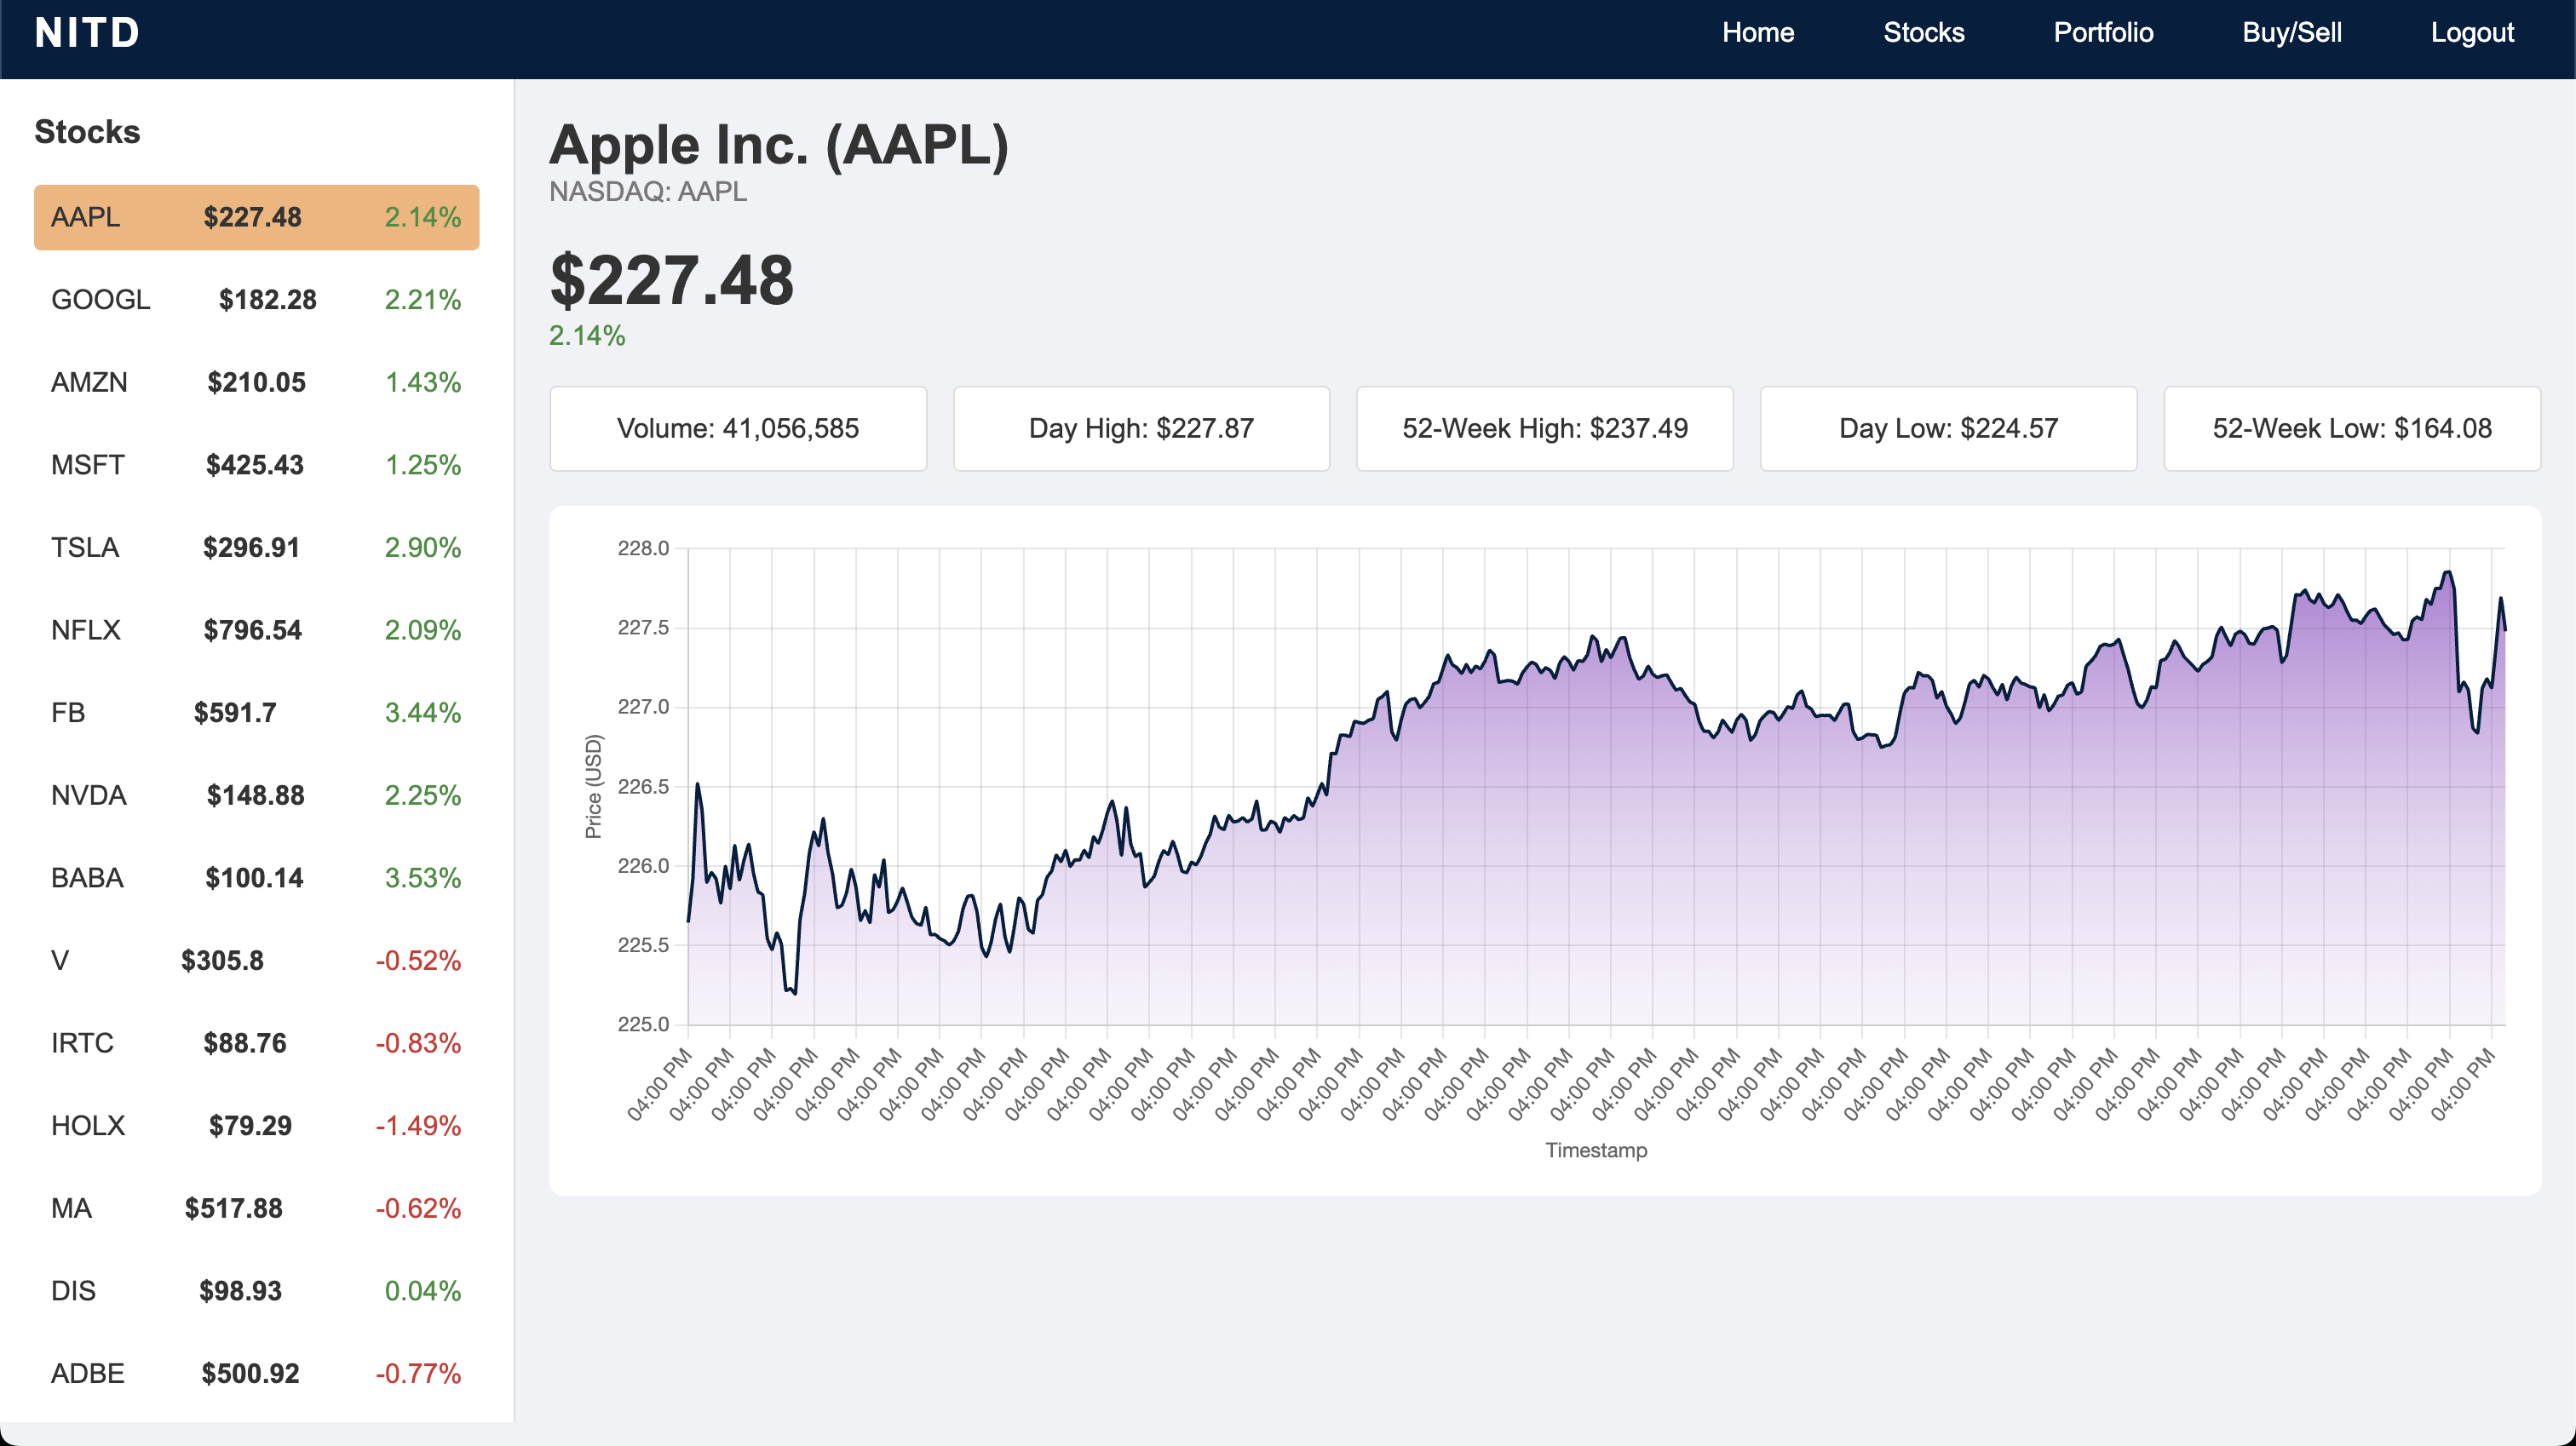
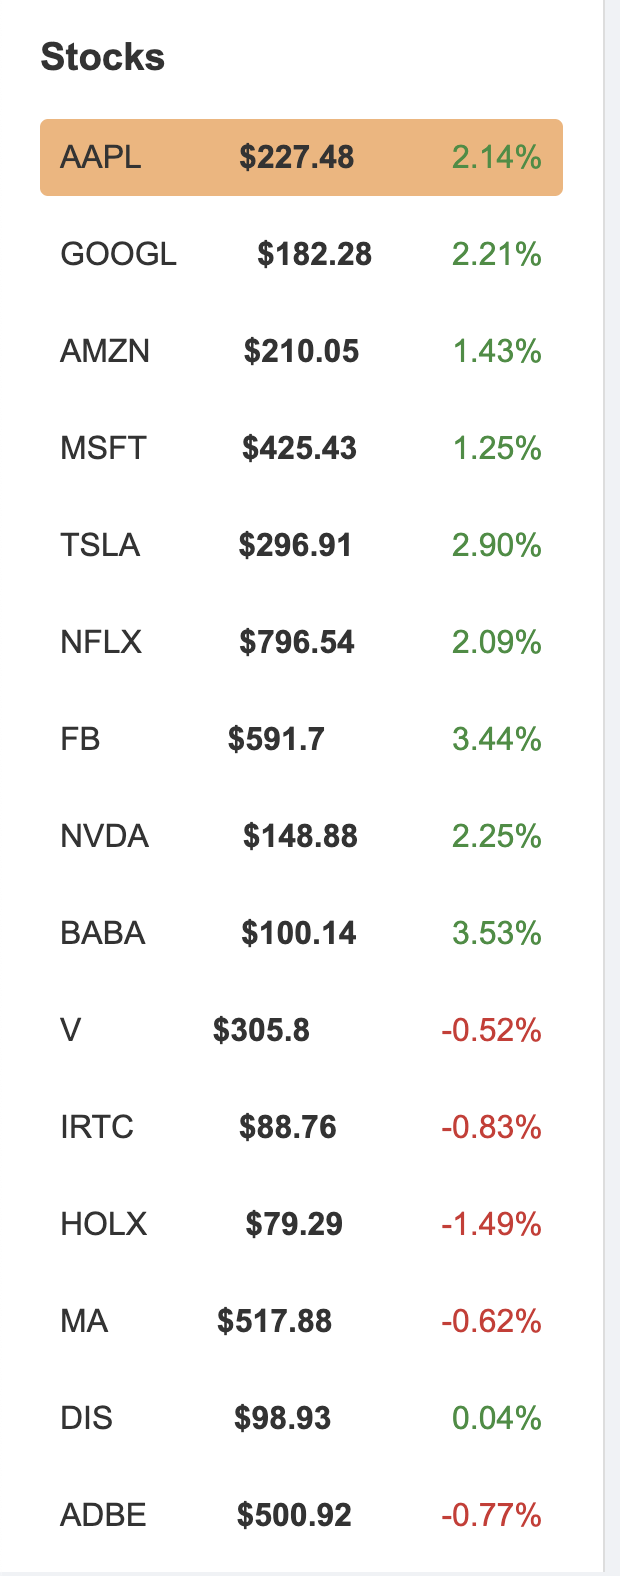
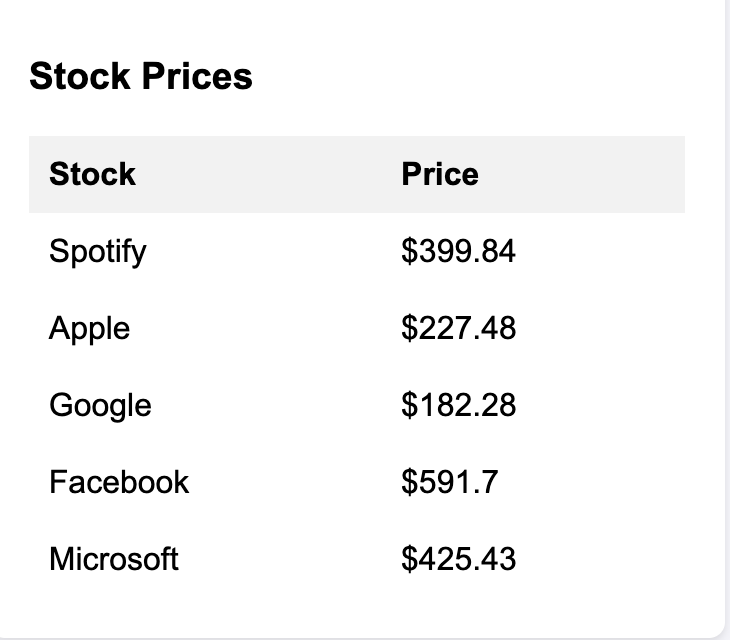
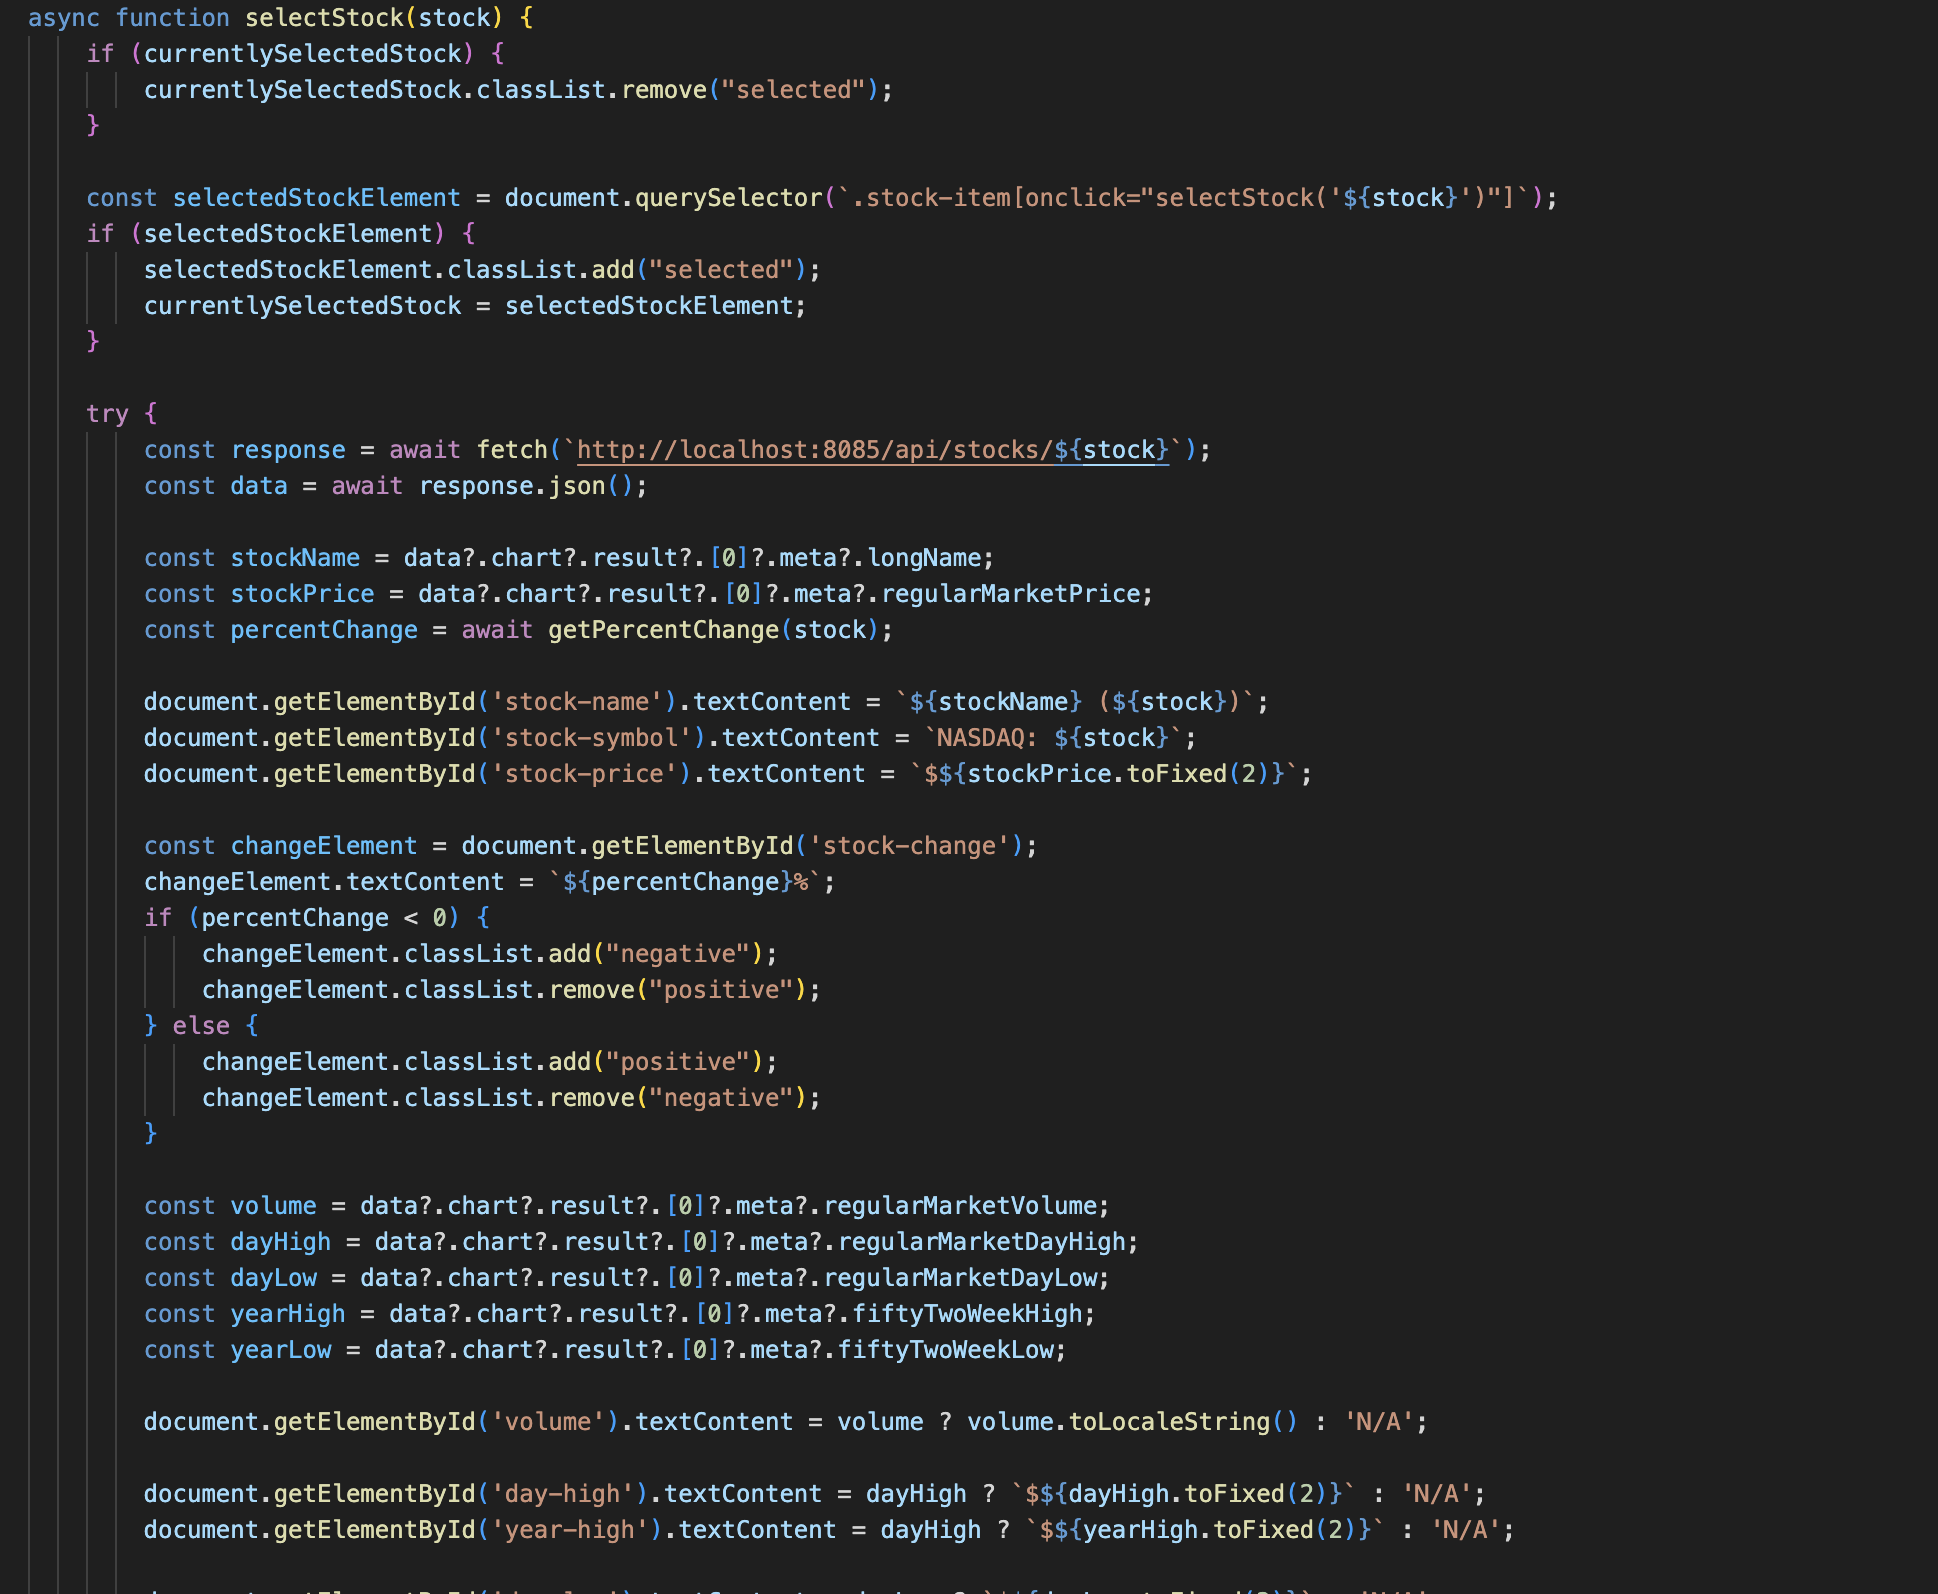
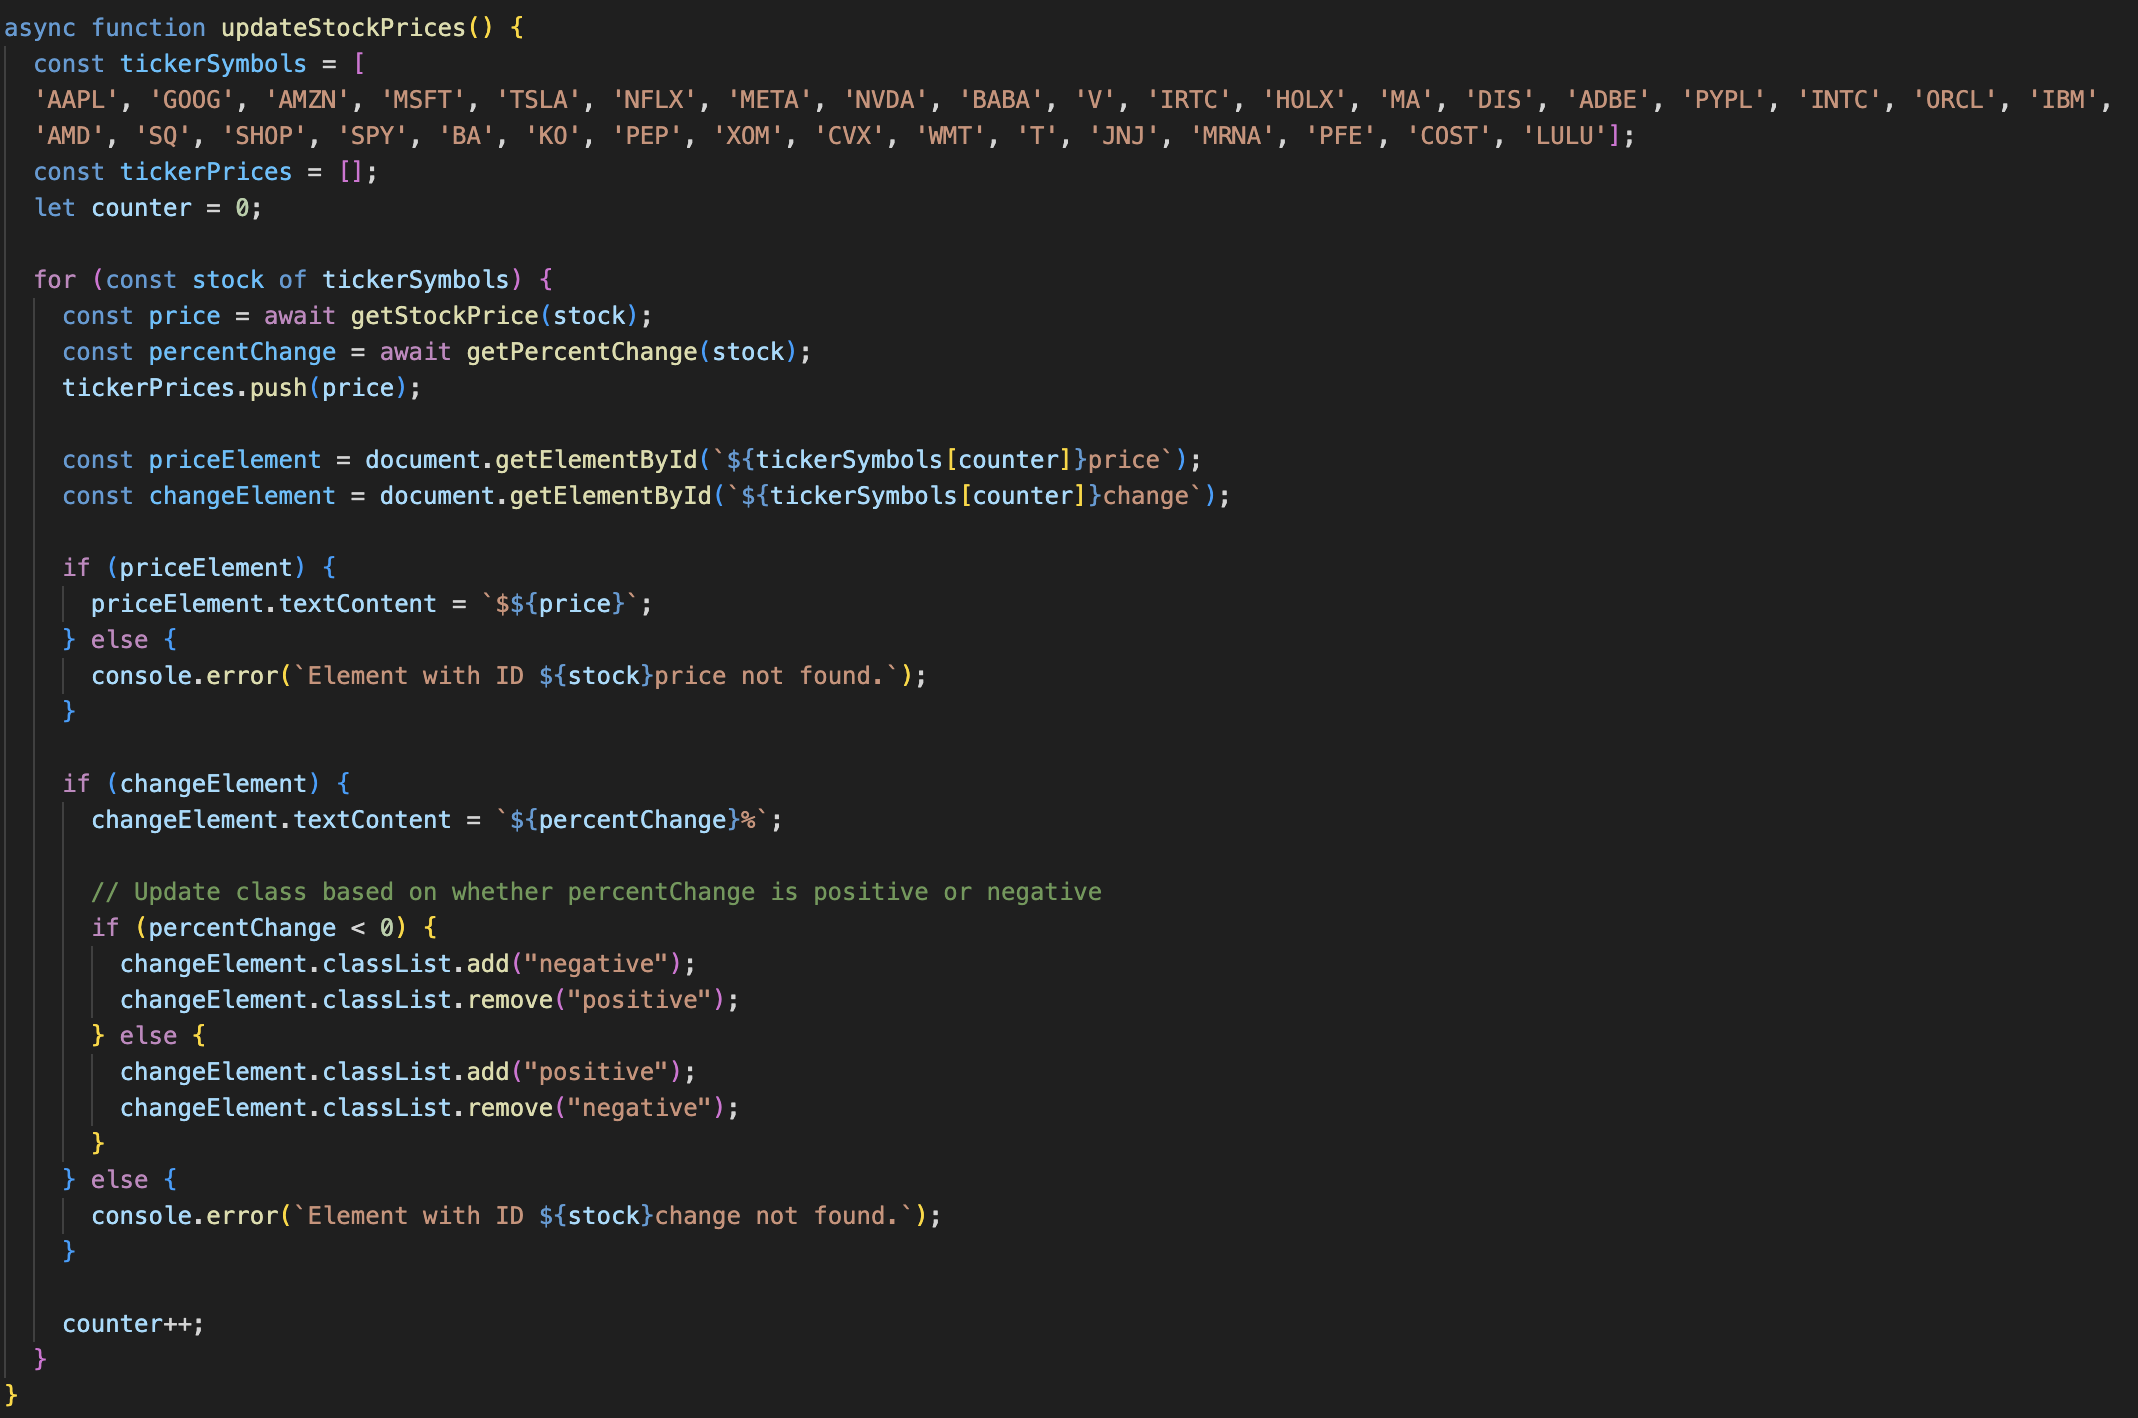
Stocks Page: Provides a comprehensive list of over 35 stocks, along with in-depth information on each, including real-time stock data, charts, and performance insights.
-
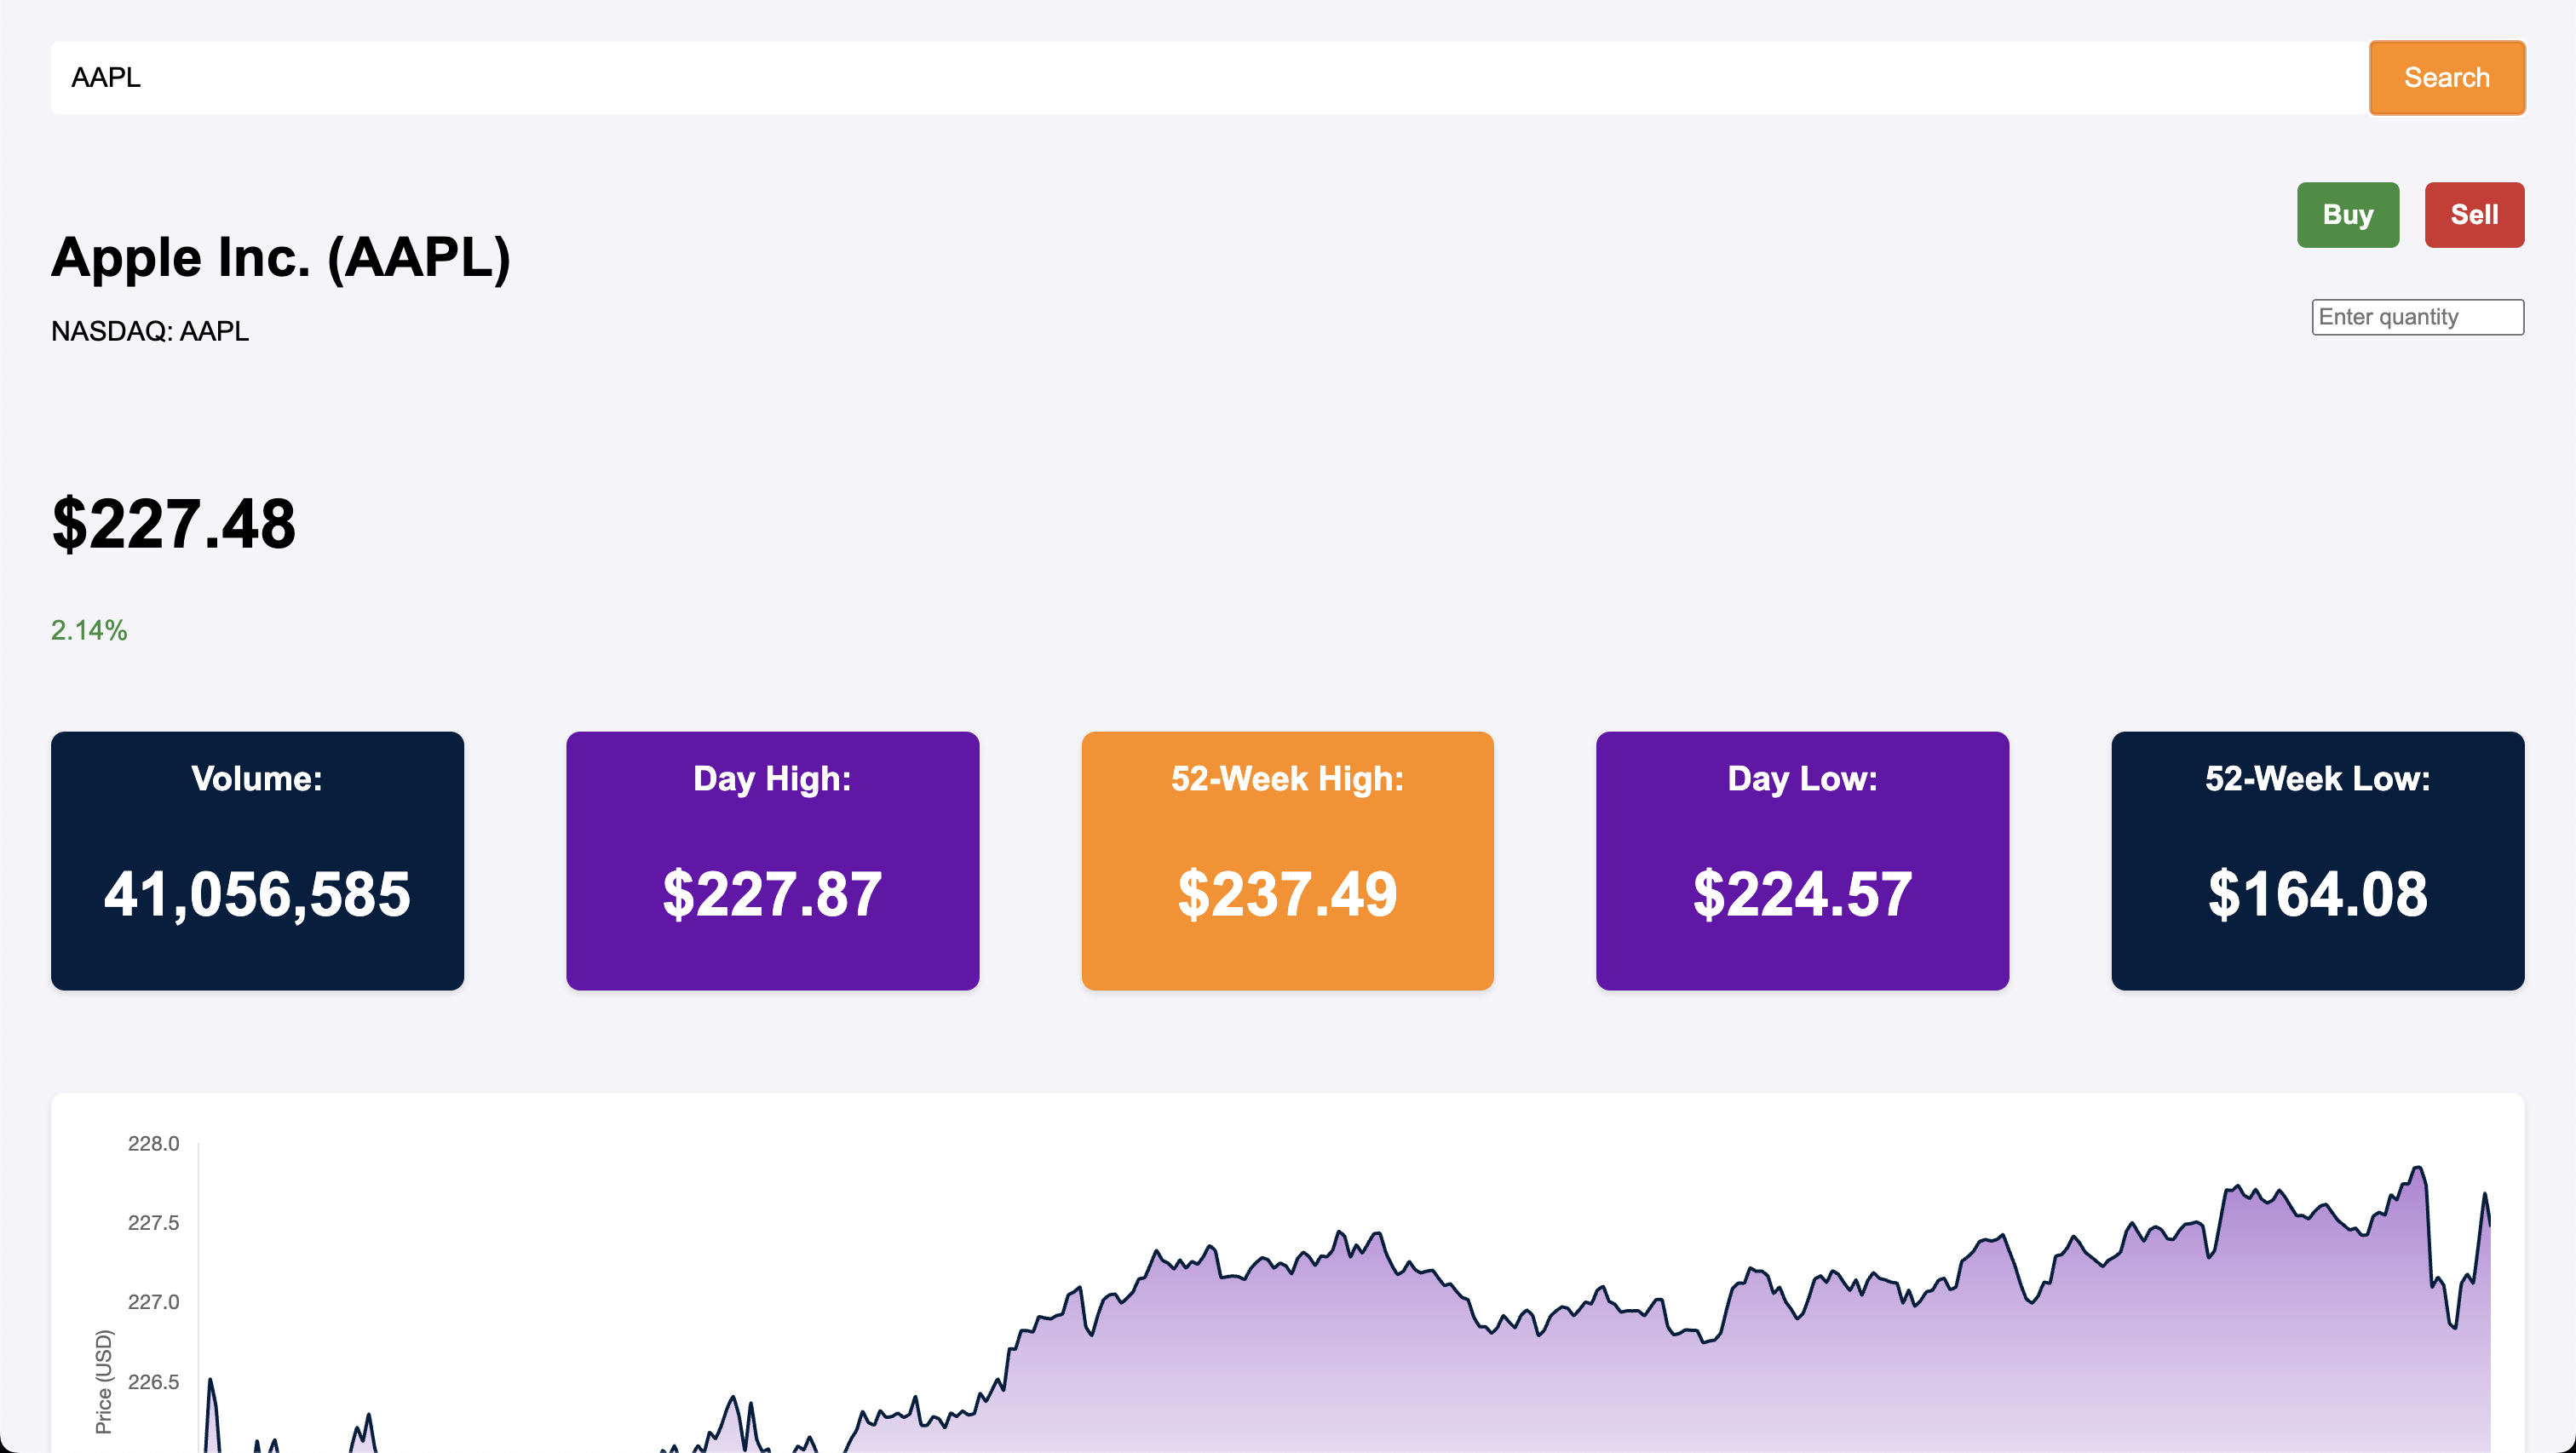
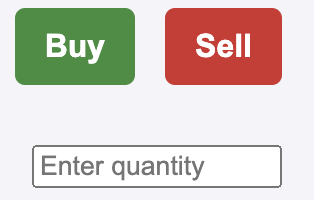
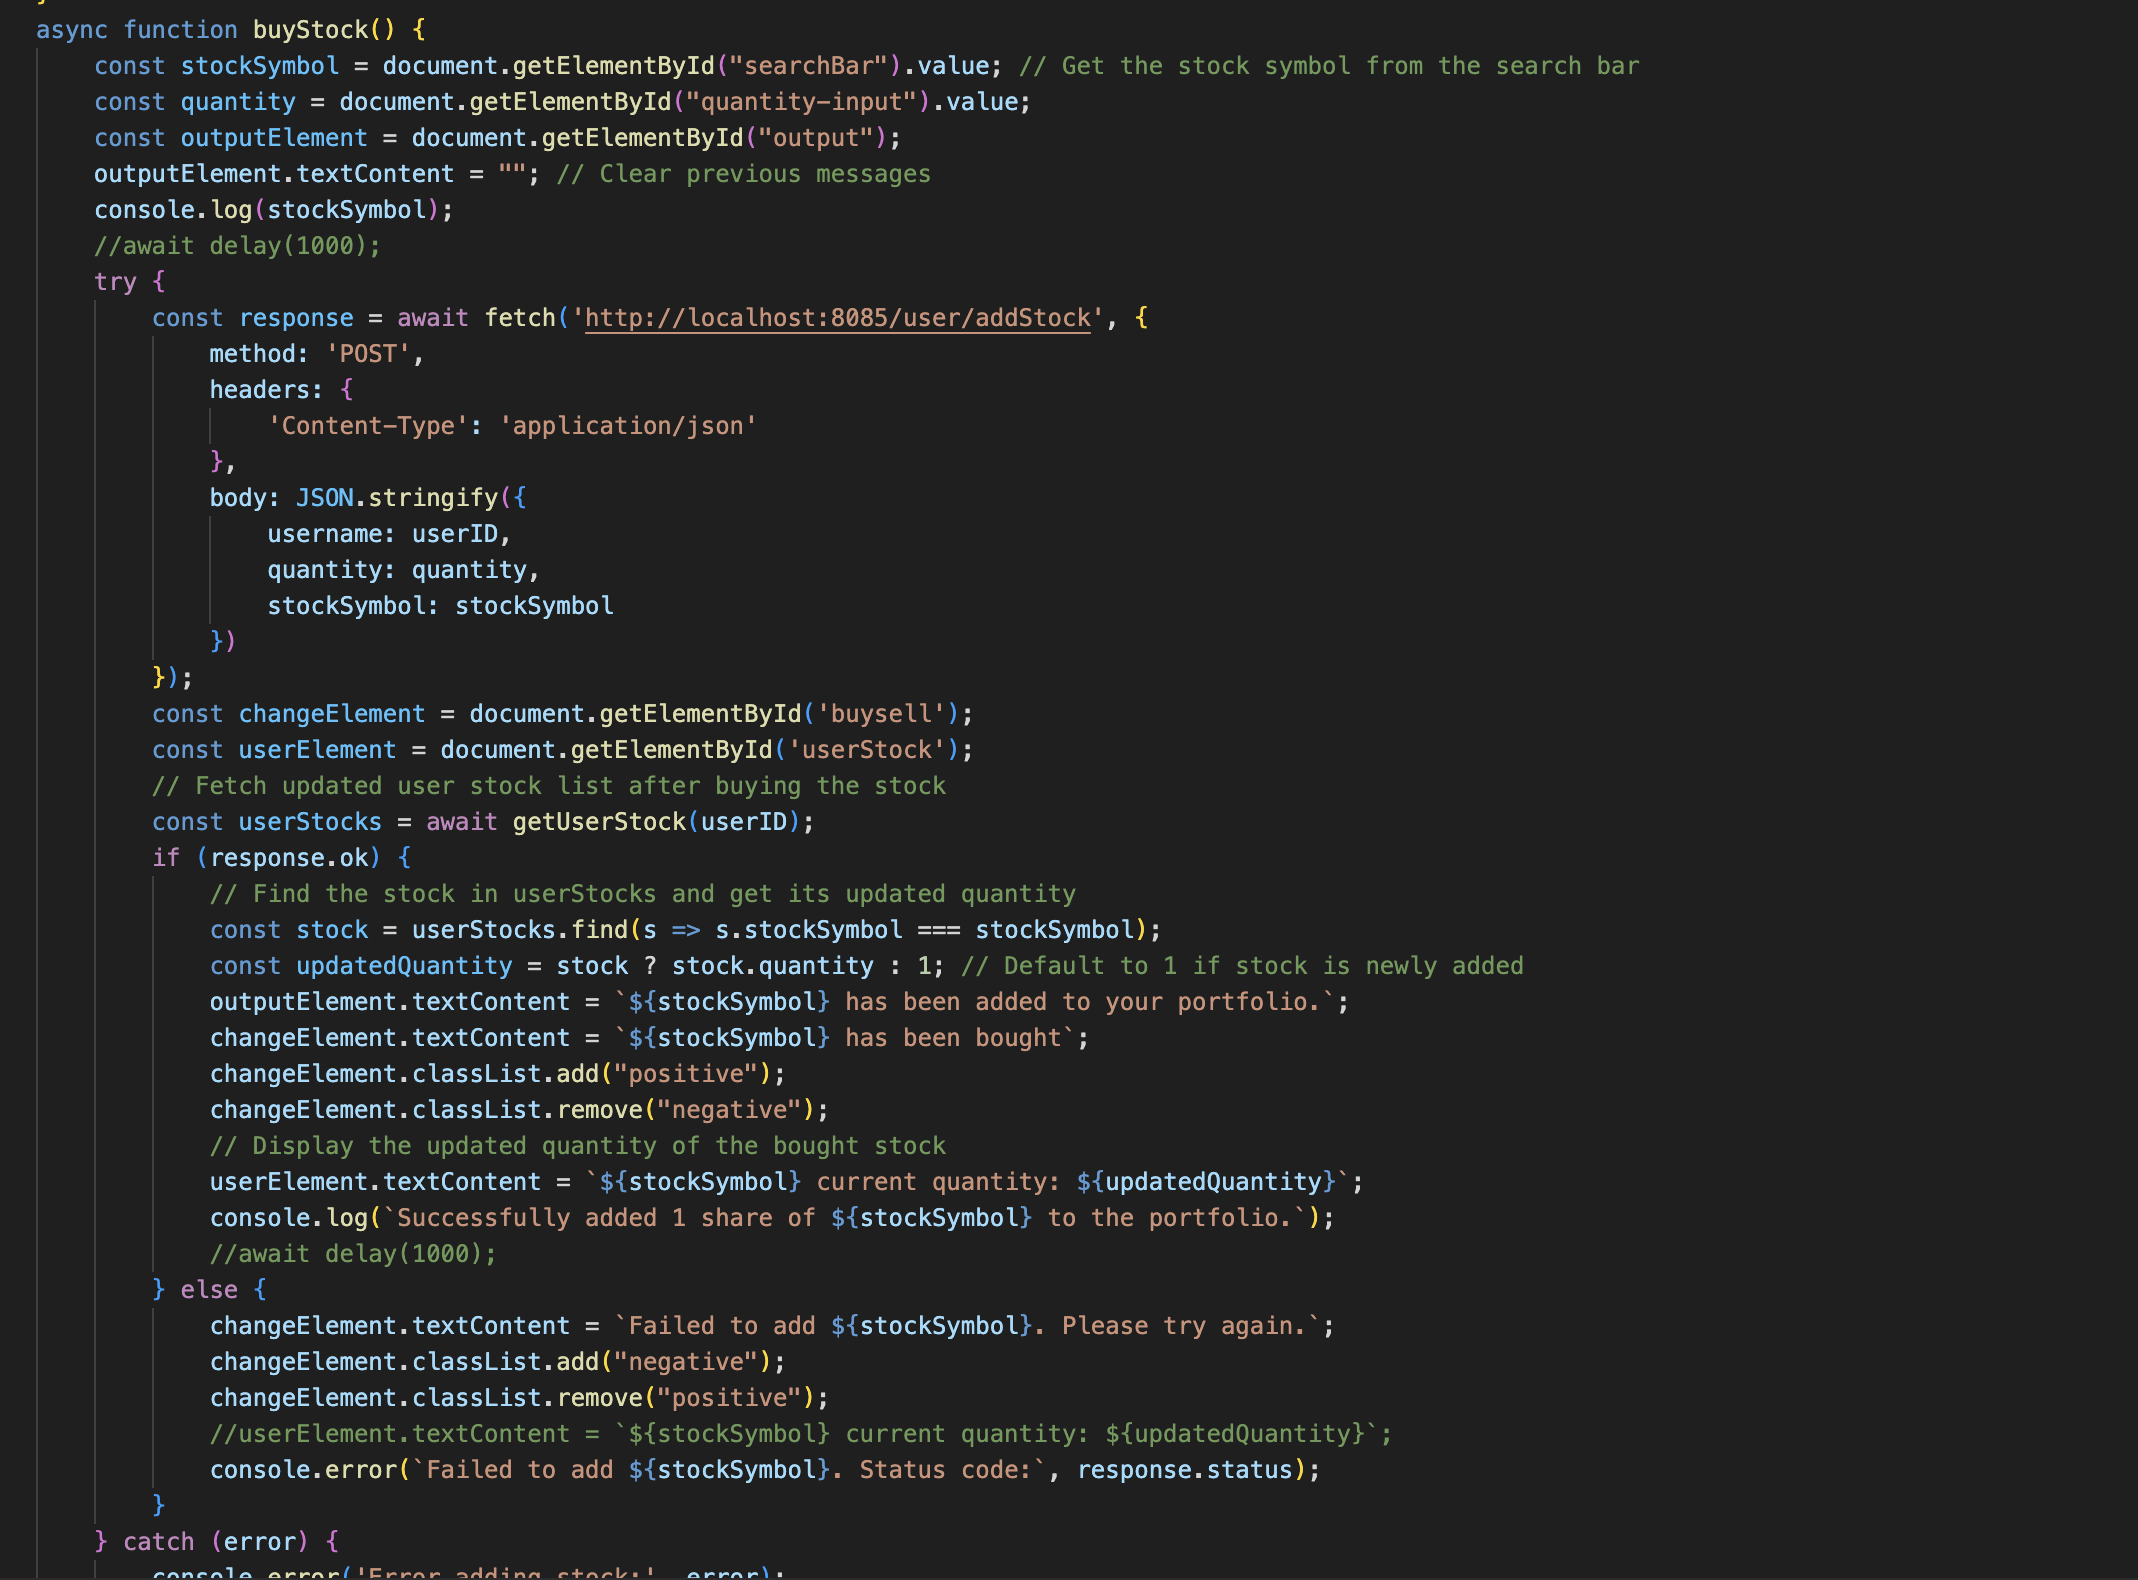
Buy/Sell Page: Users can search for a specific stock, define the quantity they wish to buy or sell, and complete transactions. The interface is intuitive and allows users to manage their portfolio efficiently.
-
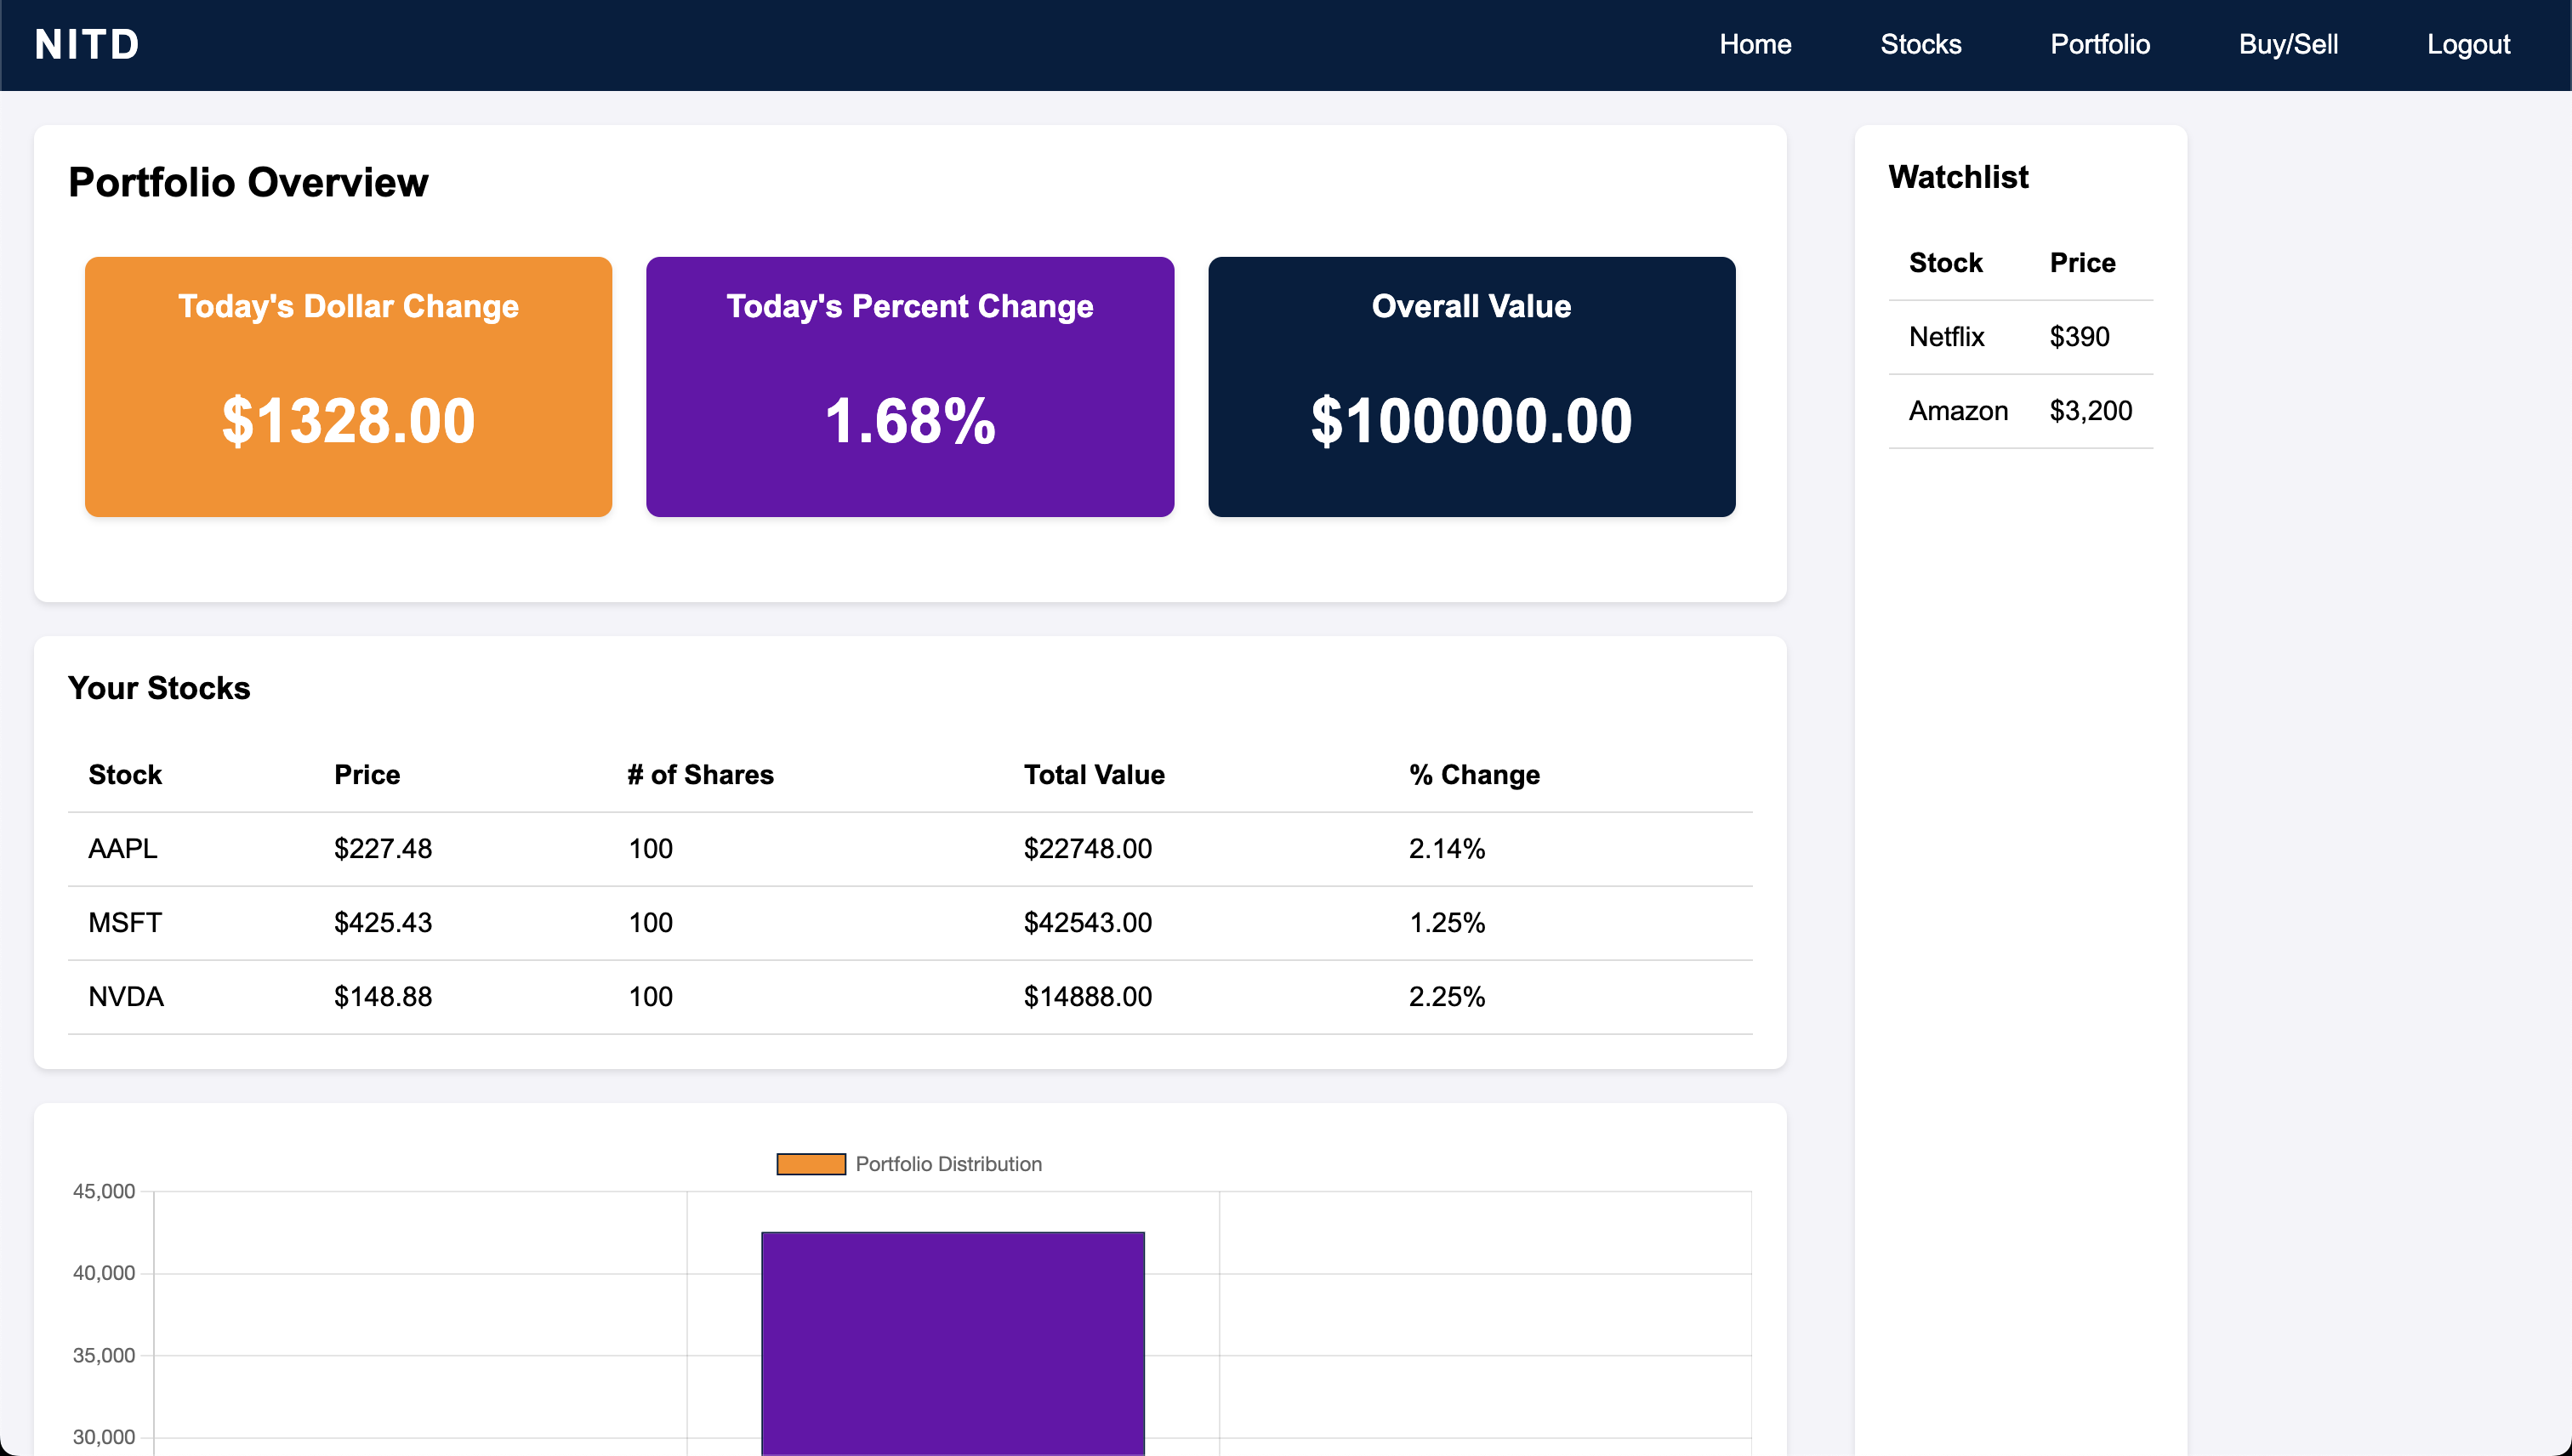
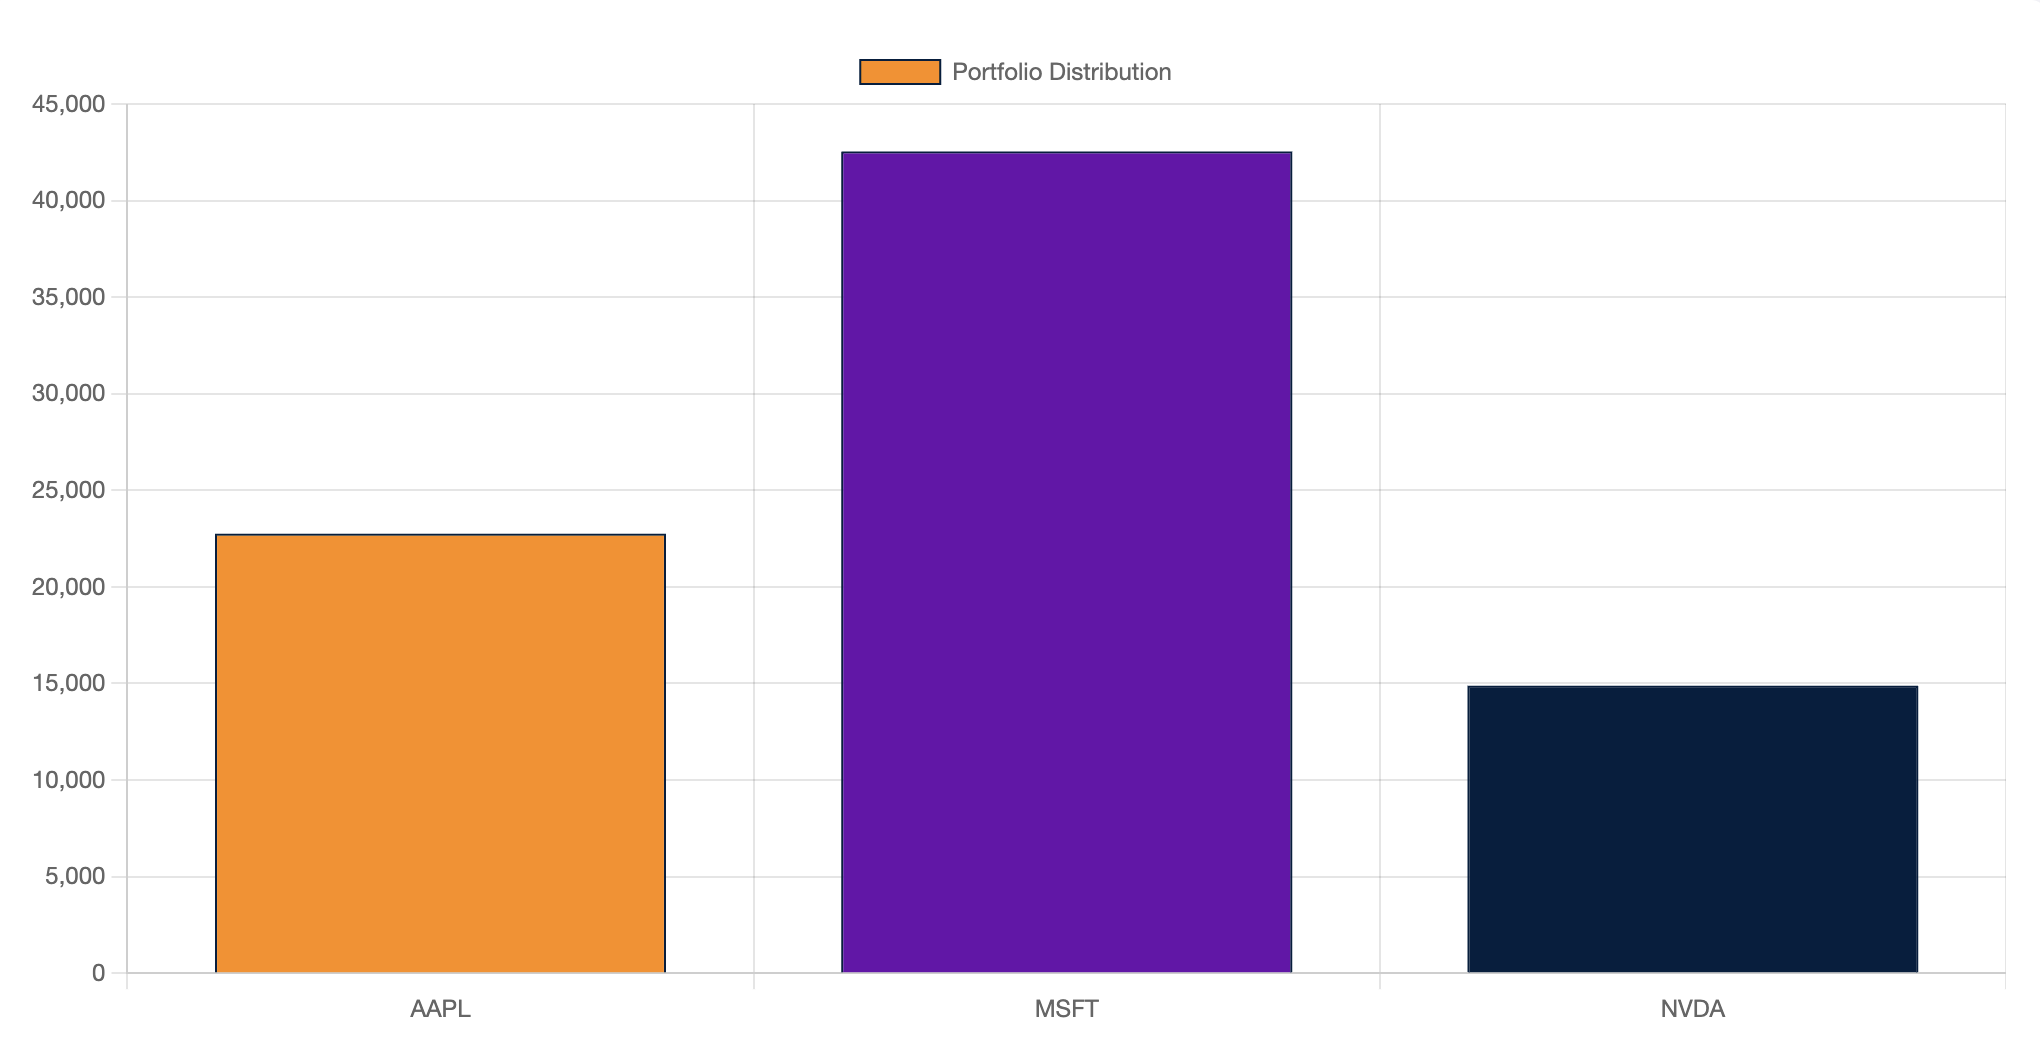
Portfolio Page: Features both a chart and a graph to visually display portfolio performance, including the current value of investments, changes in stock prices, and overall growth. This page provides users with a clear view of their portfolio’s performance over time.
-
Overall Concept: This is a productivity game designed to help users learn about stock investments in a fun, interactive way while simulating real-life stock market scenarios.
Understanding and Development:
Inputs:
- The simulator accepts various inputs, including ticker symbols for stock searches, selected stocks from the list on the stocks page, and the quantity of stocks to be traded.
- Additional inputs allow users to execute buy/sell transactions, view specific stock details, and interact with different portfolio features.

Events:
- The application triggers various events such as displaying graphs with real-time stock data, updating portfolio calculations based on transactions, and altering the stocks within the user’s portfolio.
- Events also include visual updates to charts and graphs, providing users with immediate feedback on their investment activities and portfolio performance.
Outputs:
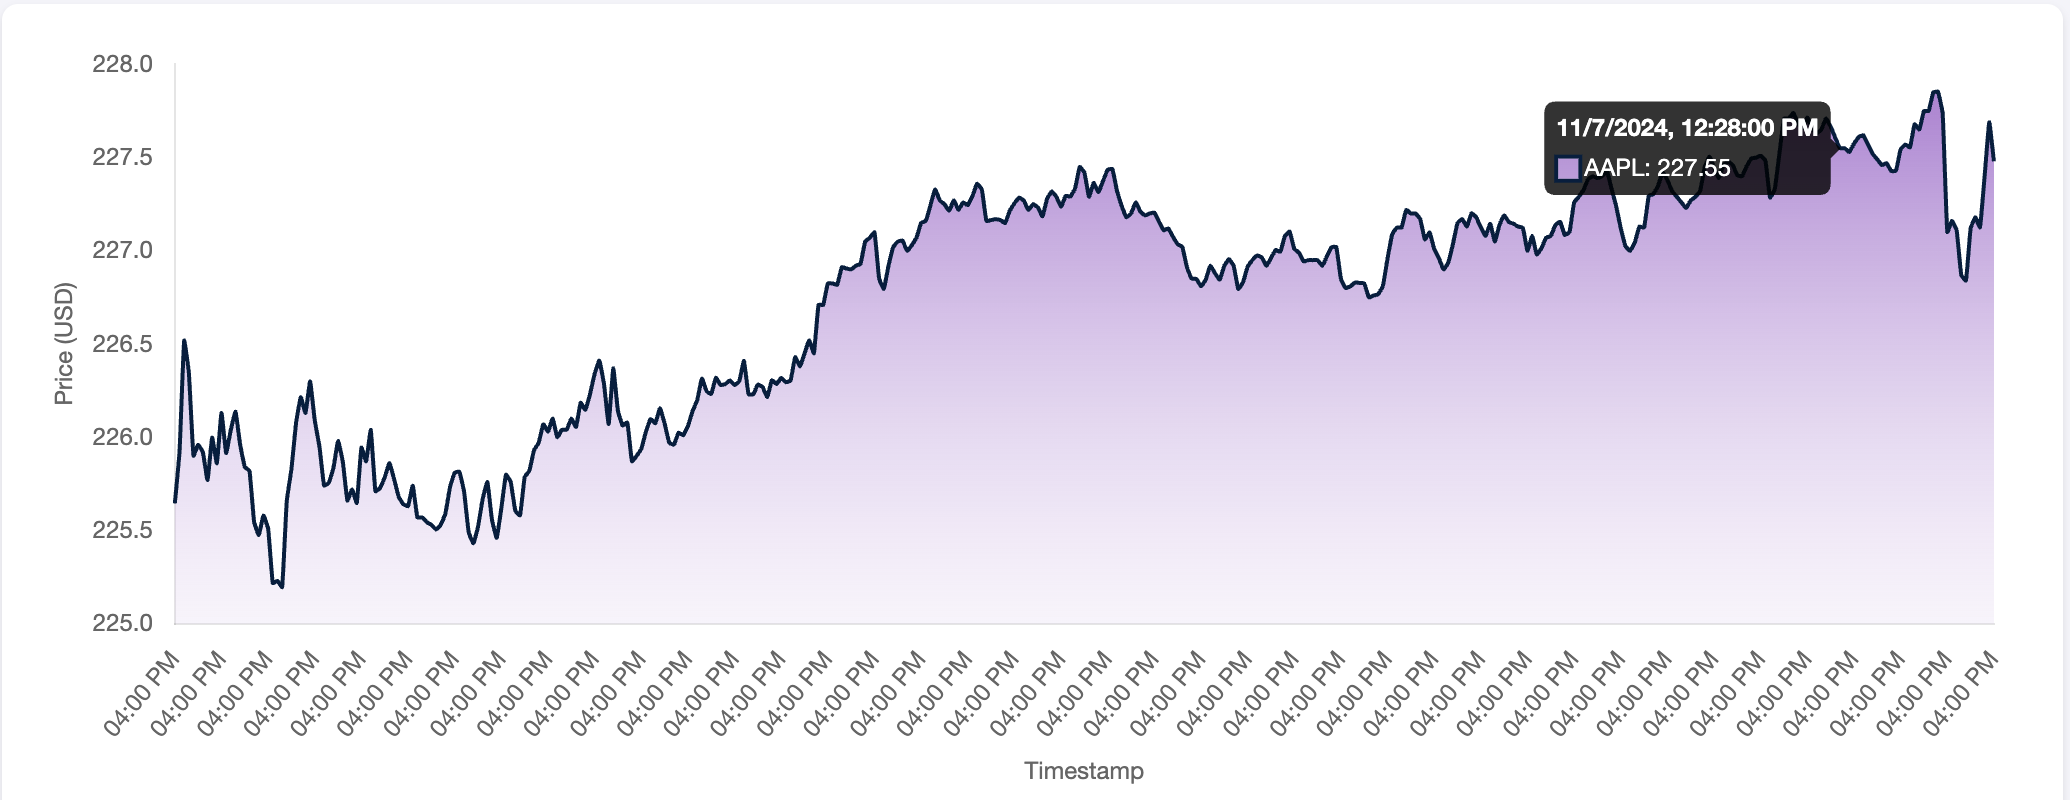
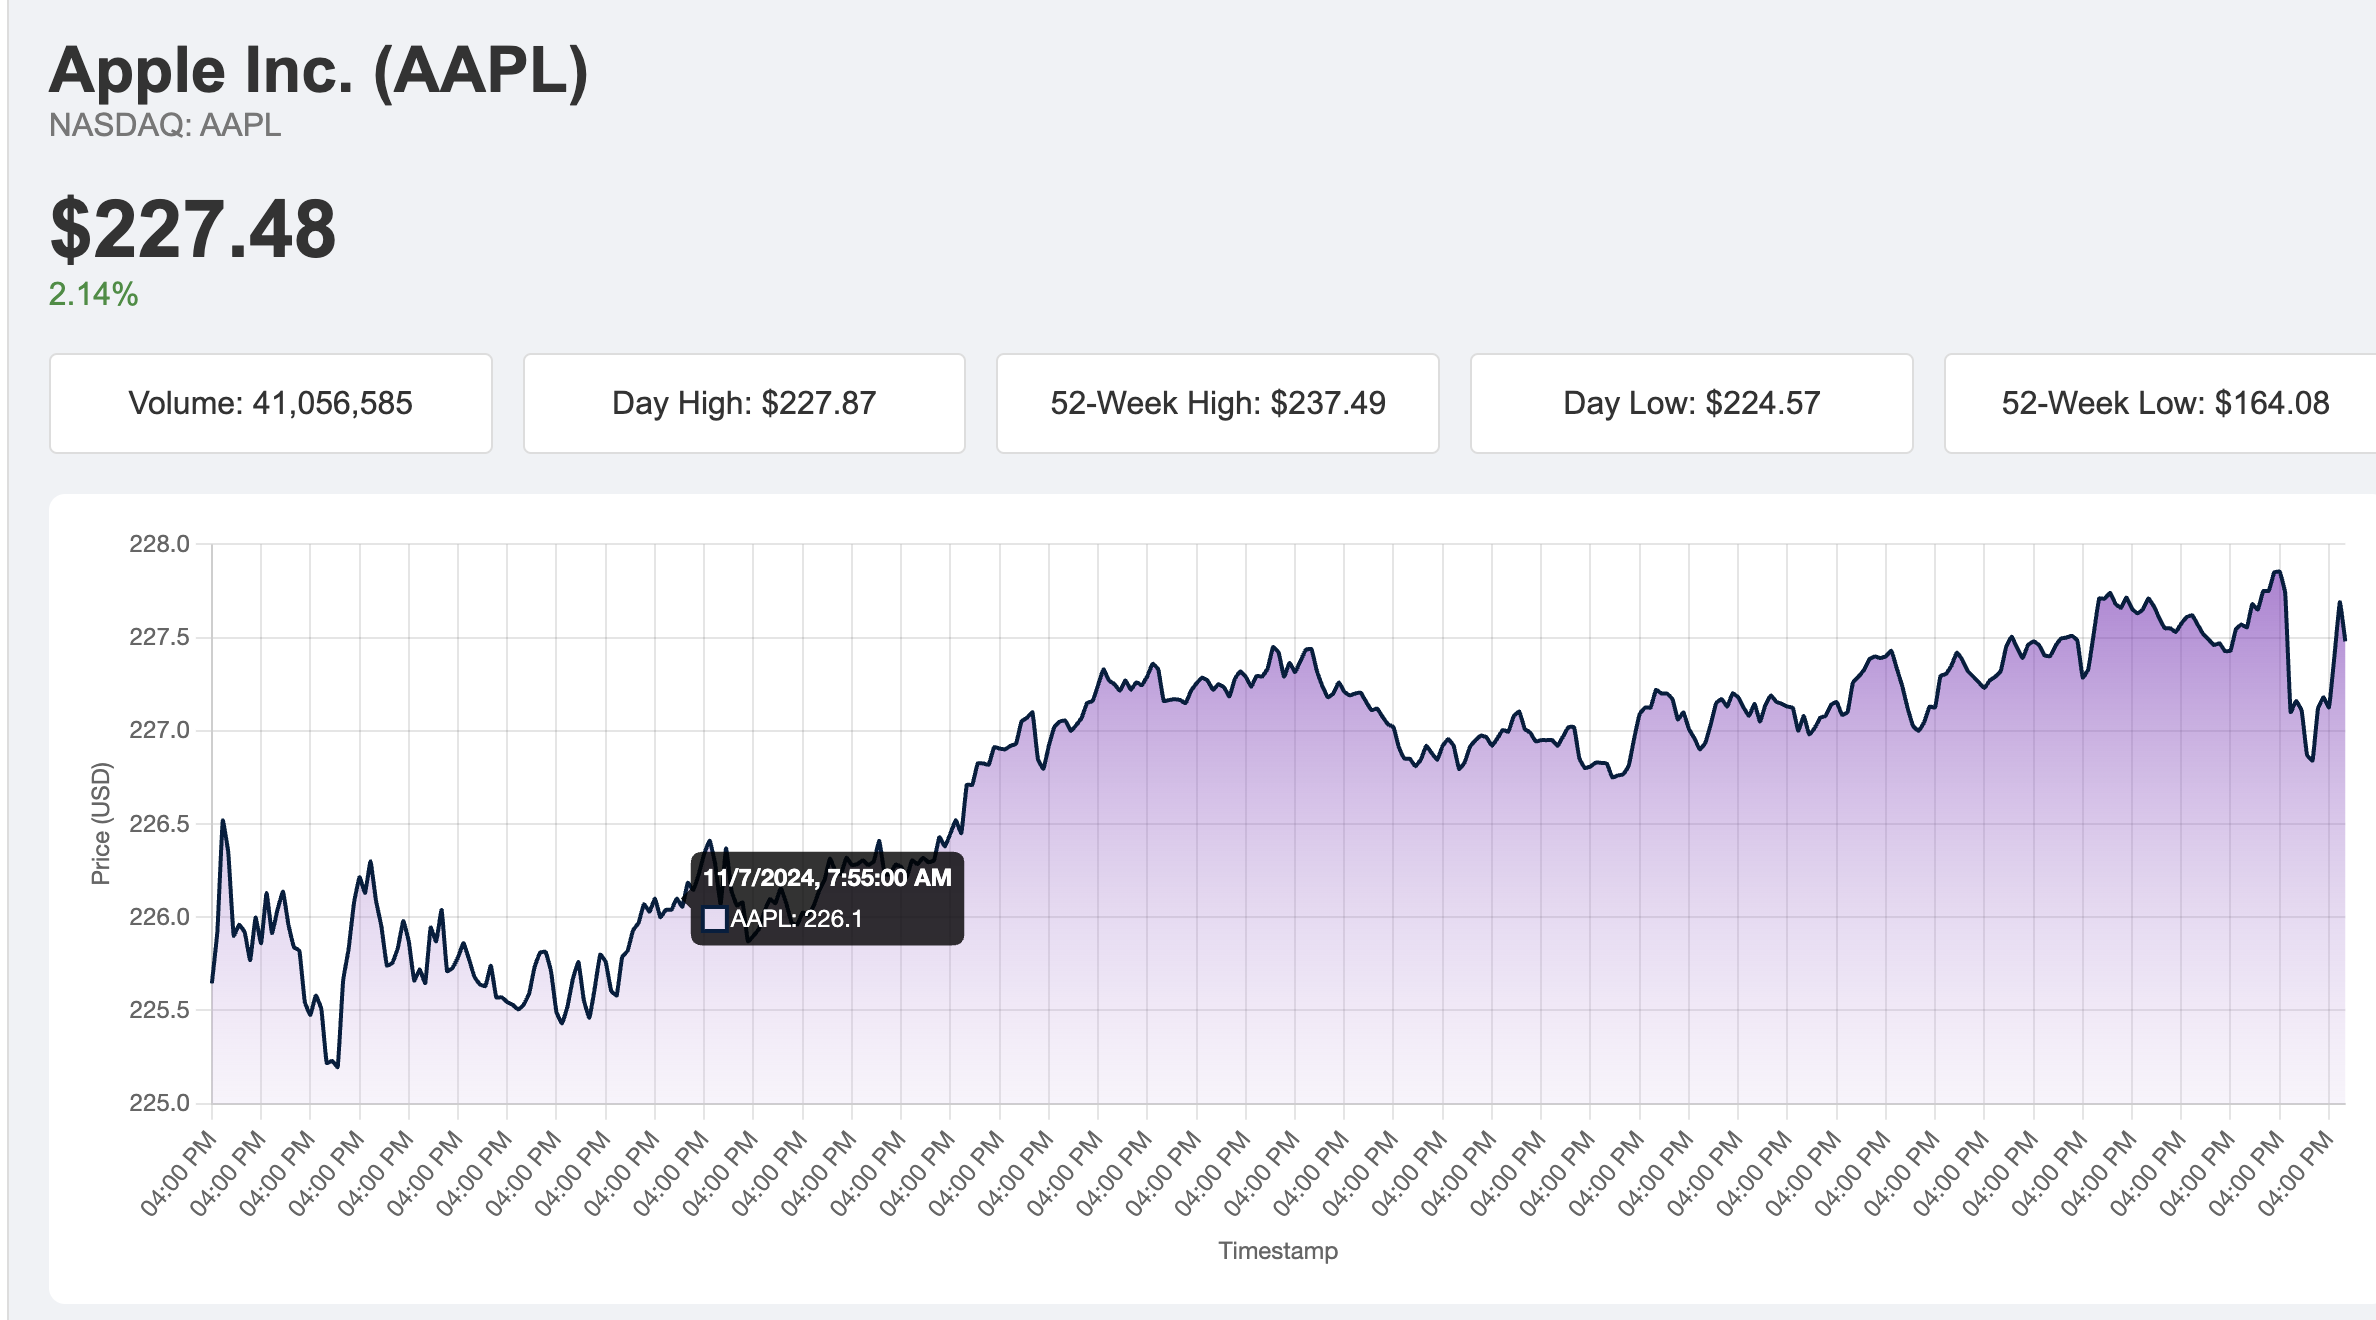
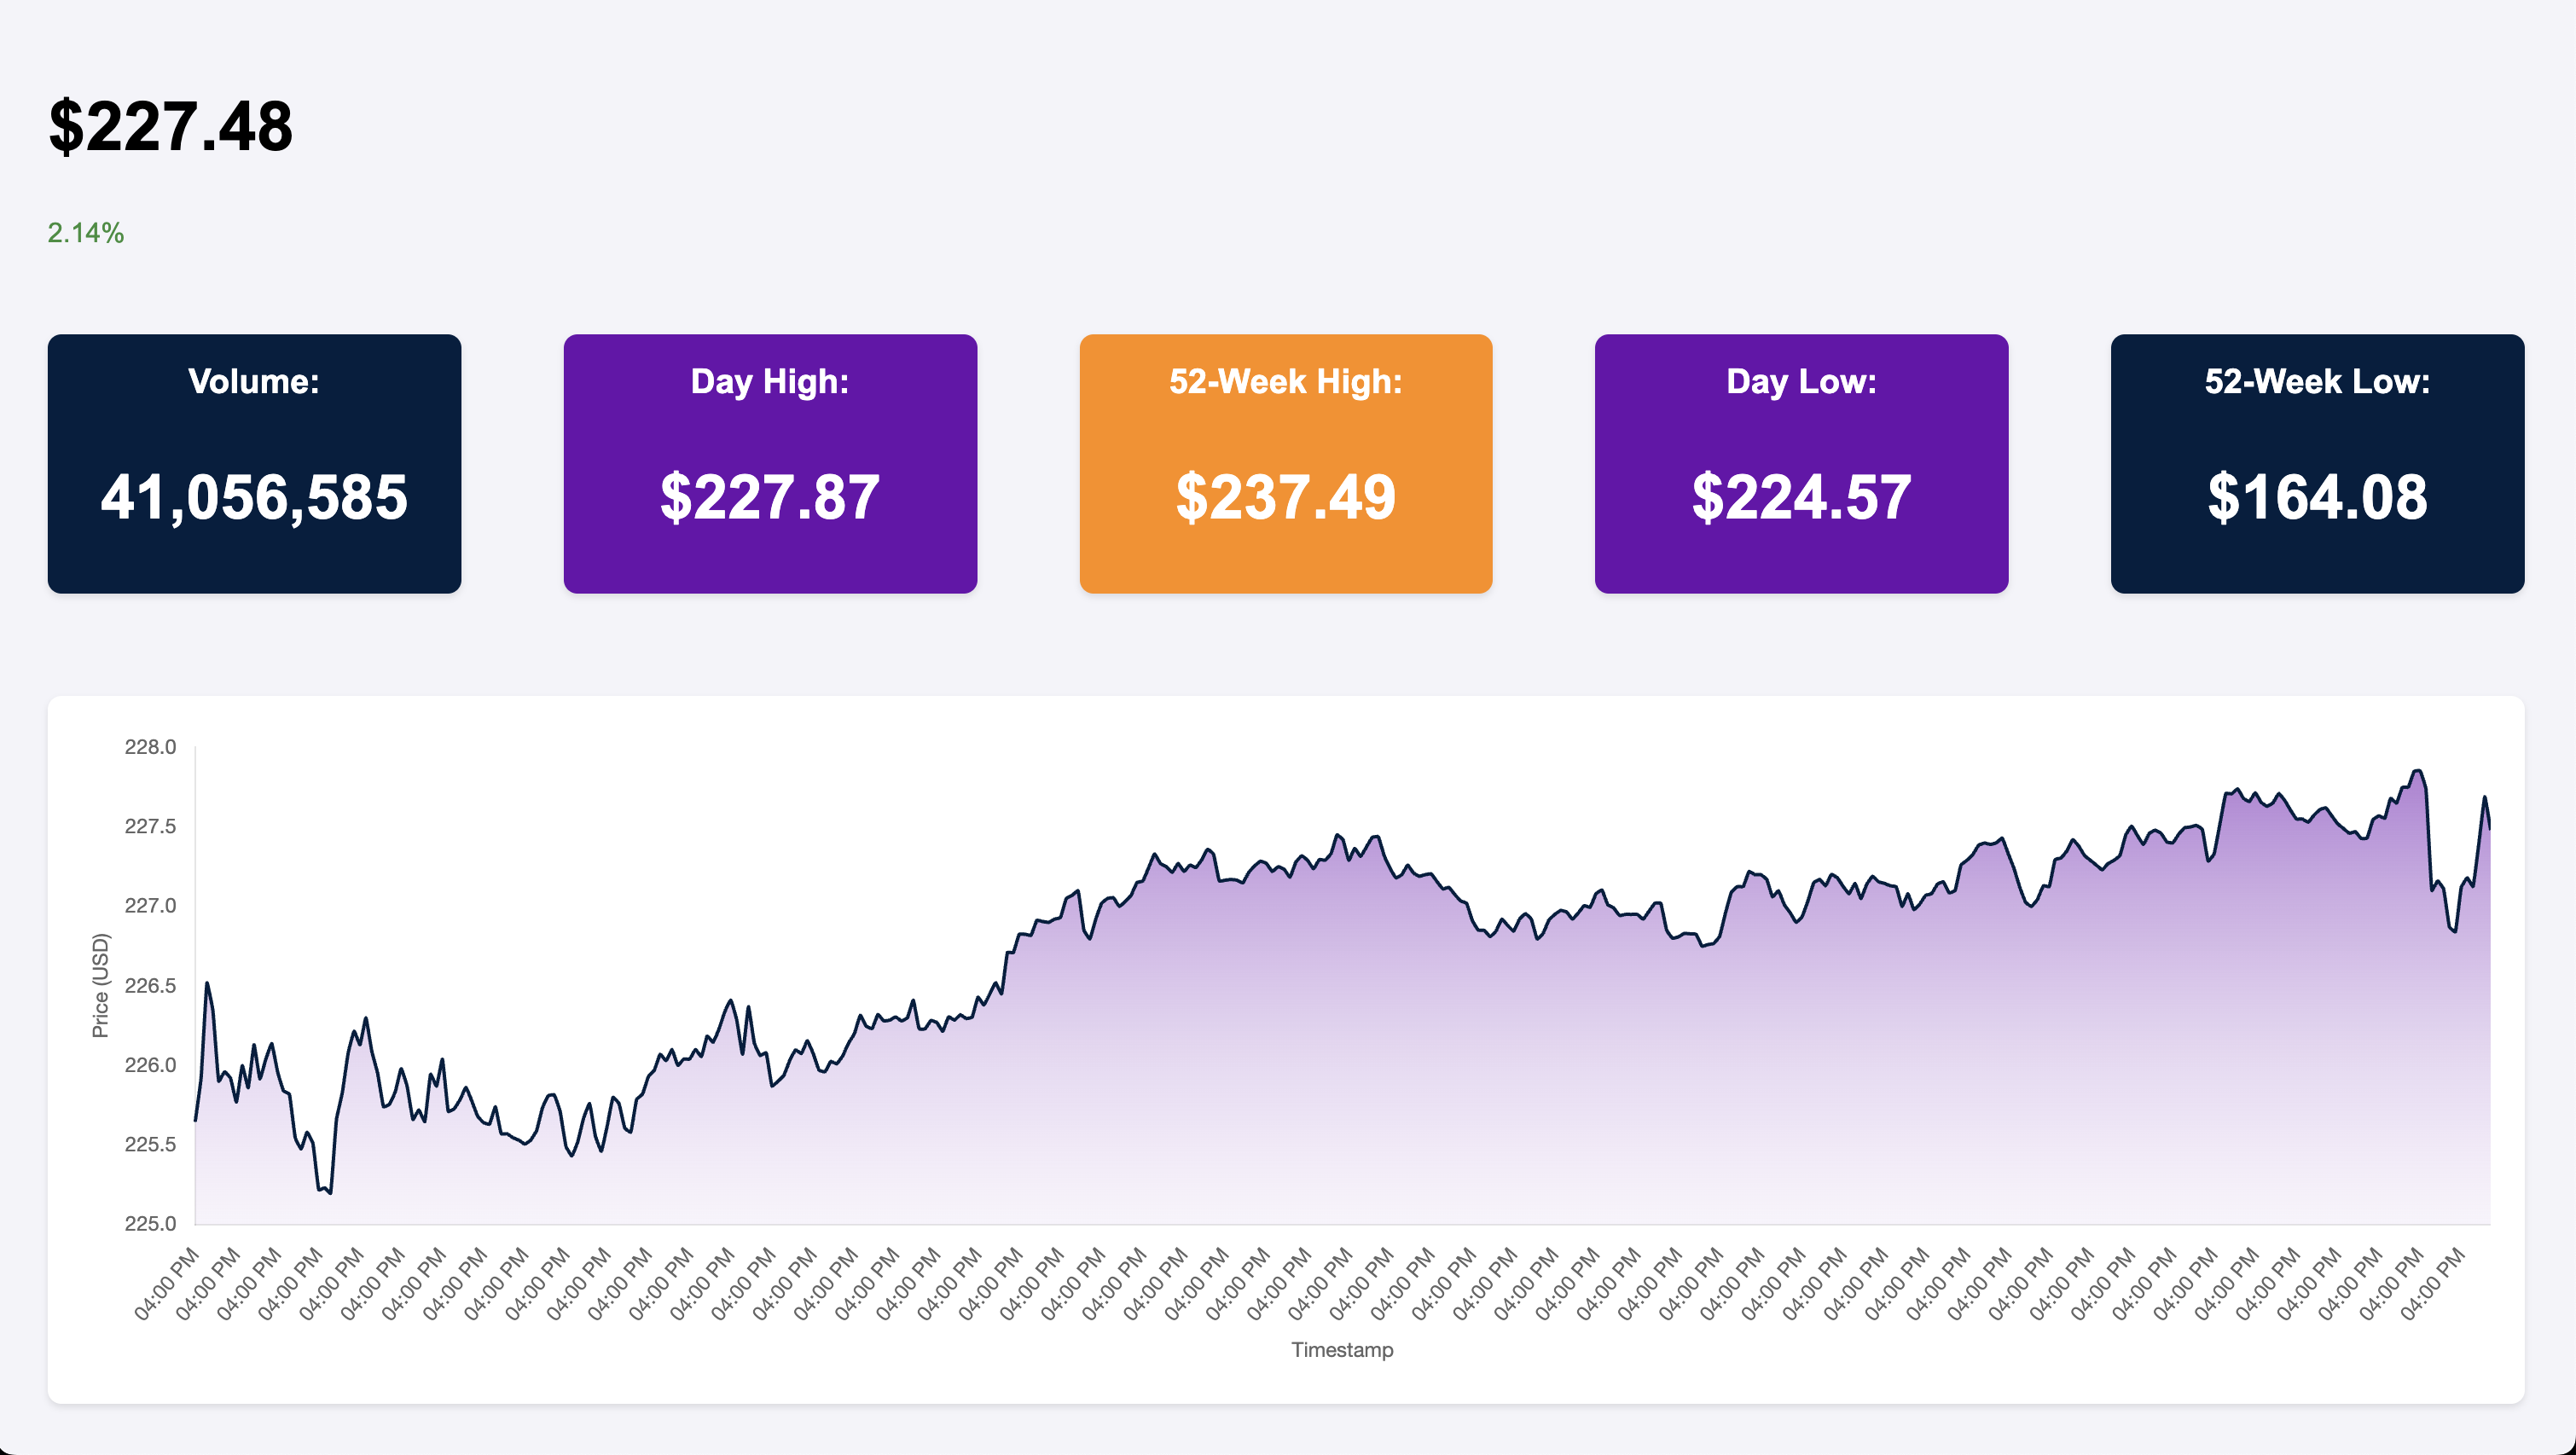
- The simulator outputs detailed stock information including volume, 52-week high/low, daily high/low, current price, and percentage changes in stock value.
- Visual outputs include real-time charts and graphs that track stock prices, portfolio growth, and dollar/percent gains for each investment. This information is crucial for helping users evaluate their investment strategies.
UI:
- The user interface is designed to be intuitive and easy to navigate. It displays essential information clearly, allowing users to interact with the simulator without feeling overwhelmed. Screenshots of the UI are provided below for reference.
Individual Coding Knowledge:
The core functionality of the application relies on several major functions that facilitate smooth interactions and real-time updates:
-
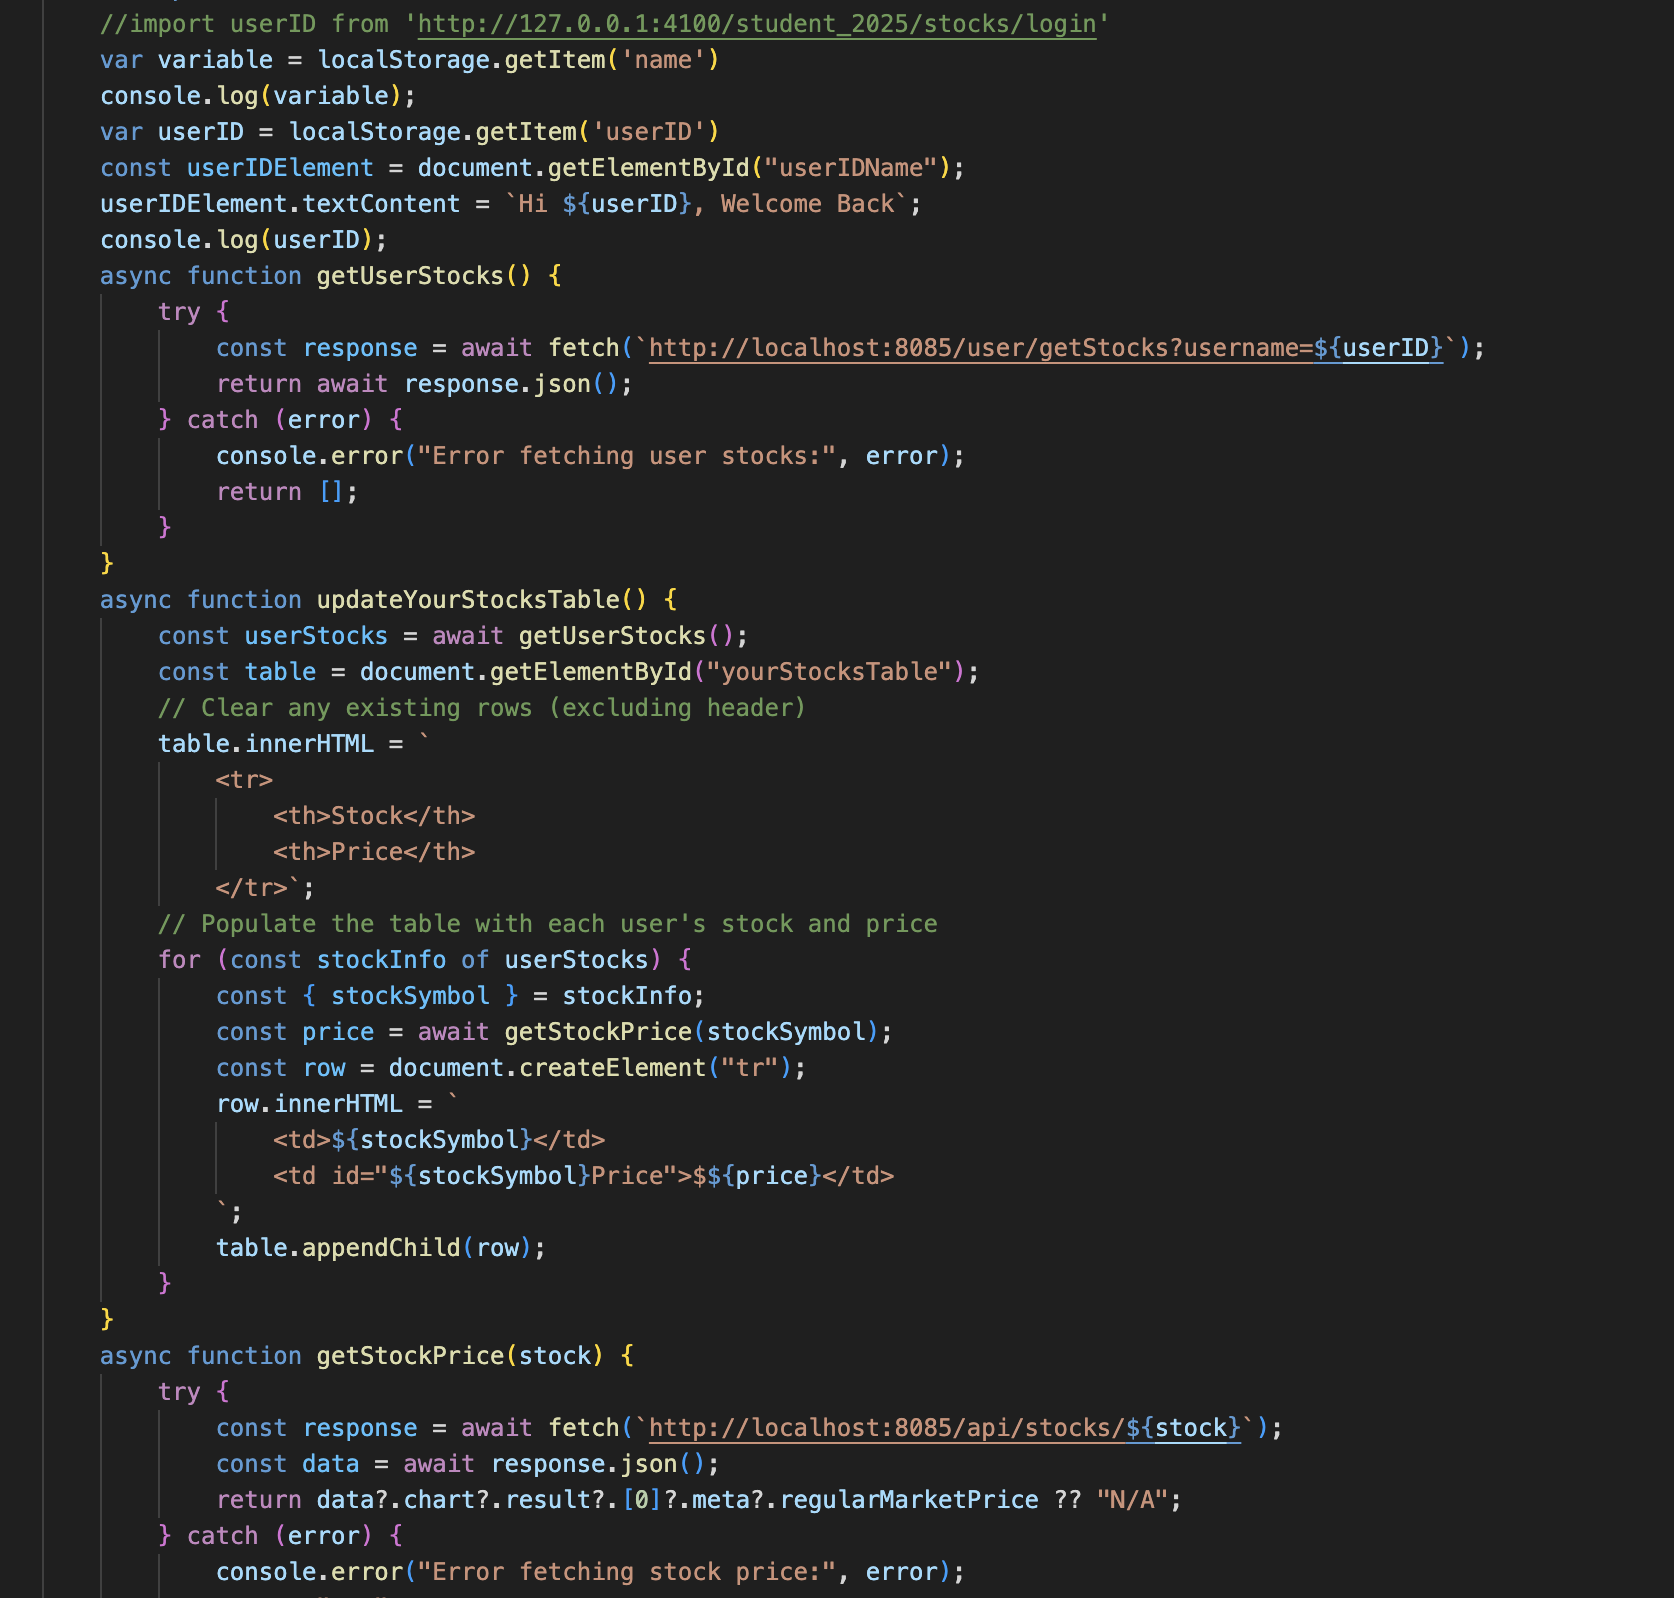
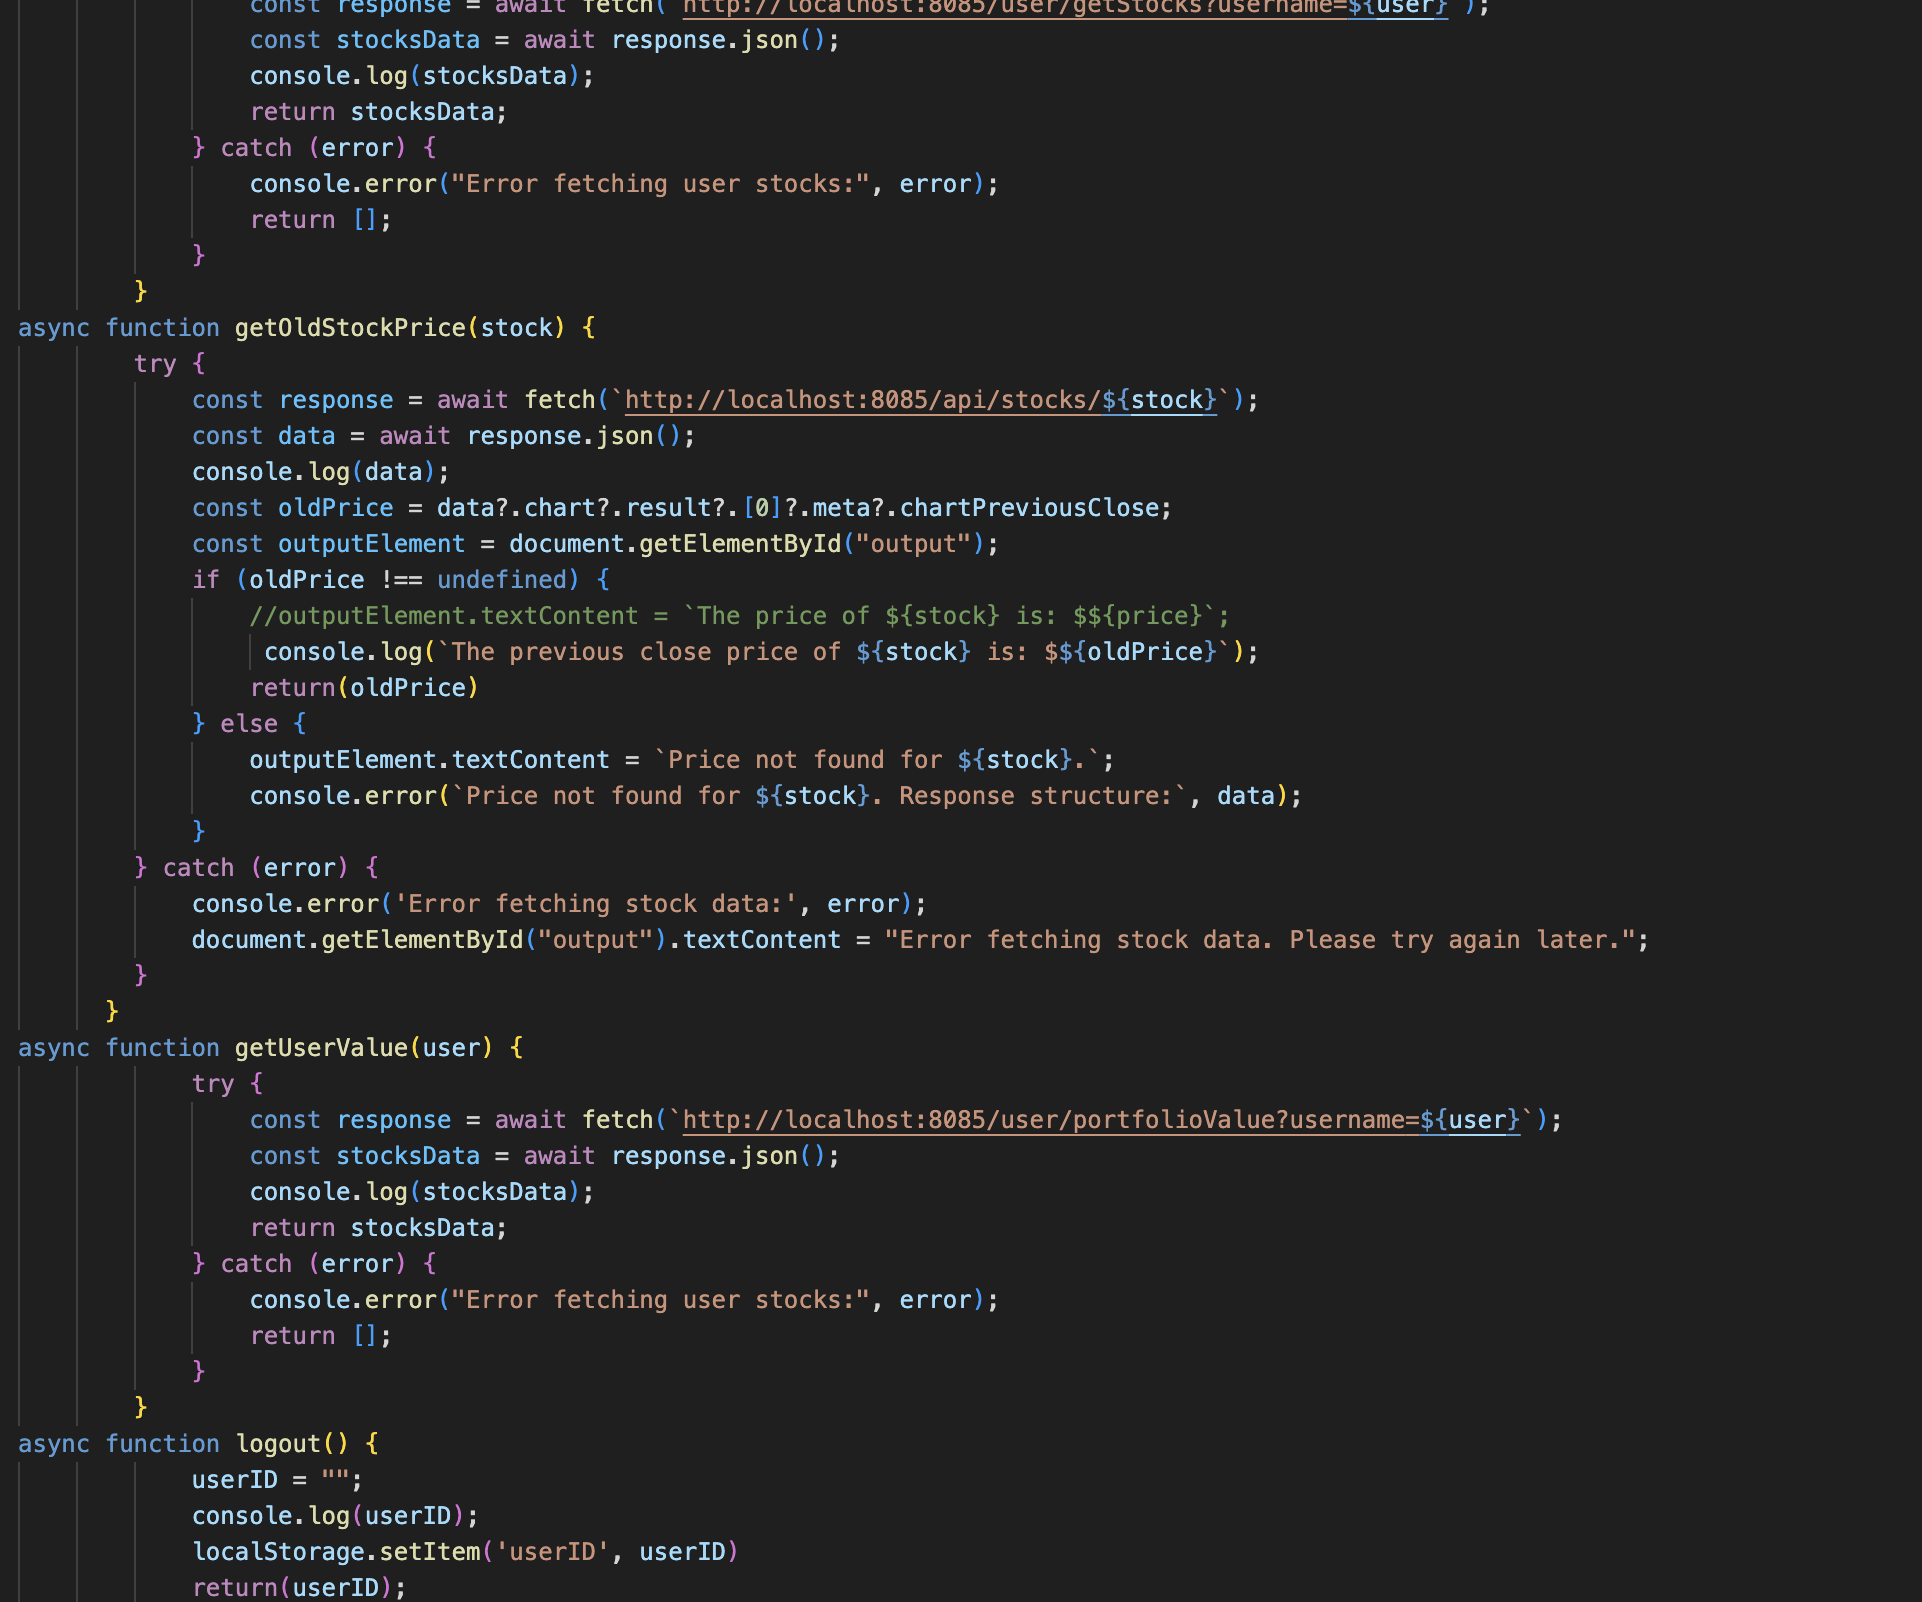
getStockPrice: Retrieves the current stock price for a given ticker symbol. This function allows users to see live updates on stock prices, ensuring that their investment decisions are based on up-to-date information.
-
getUserStock: Retrieves a list of all the stocks the user is currently investing in. This function helps manage the user’s portfolio and provides an overview of their current investments.
-
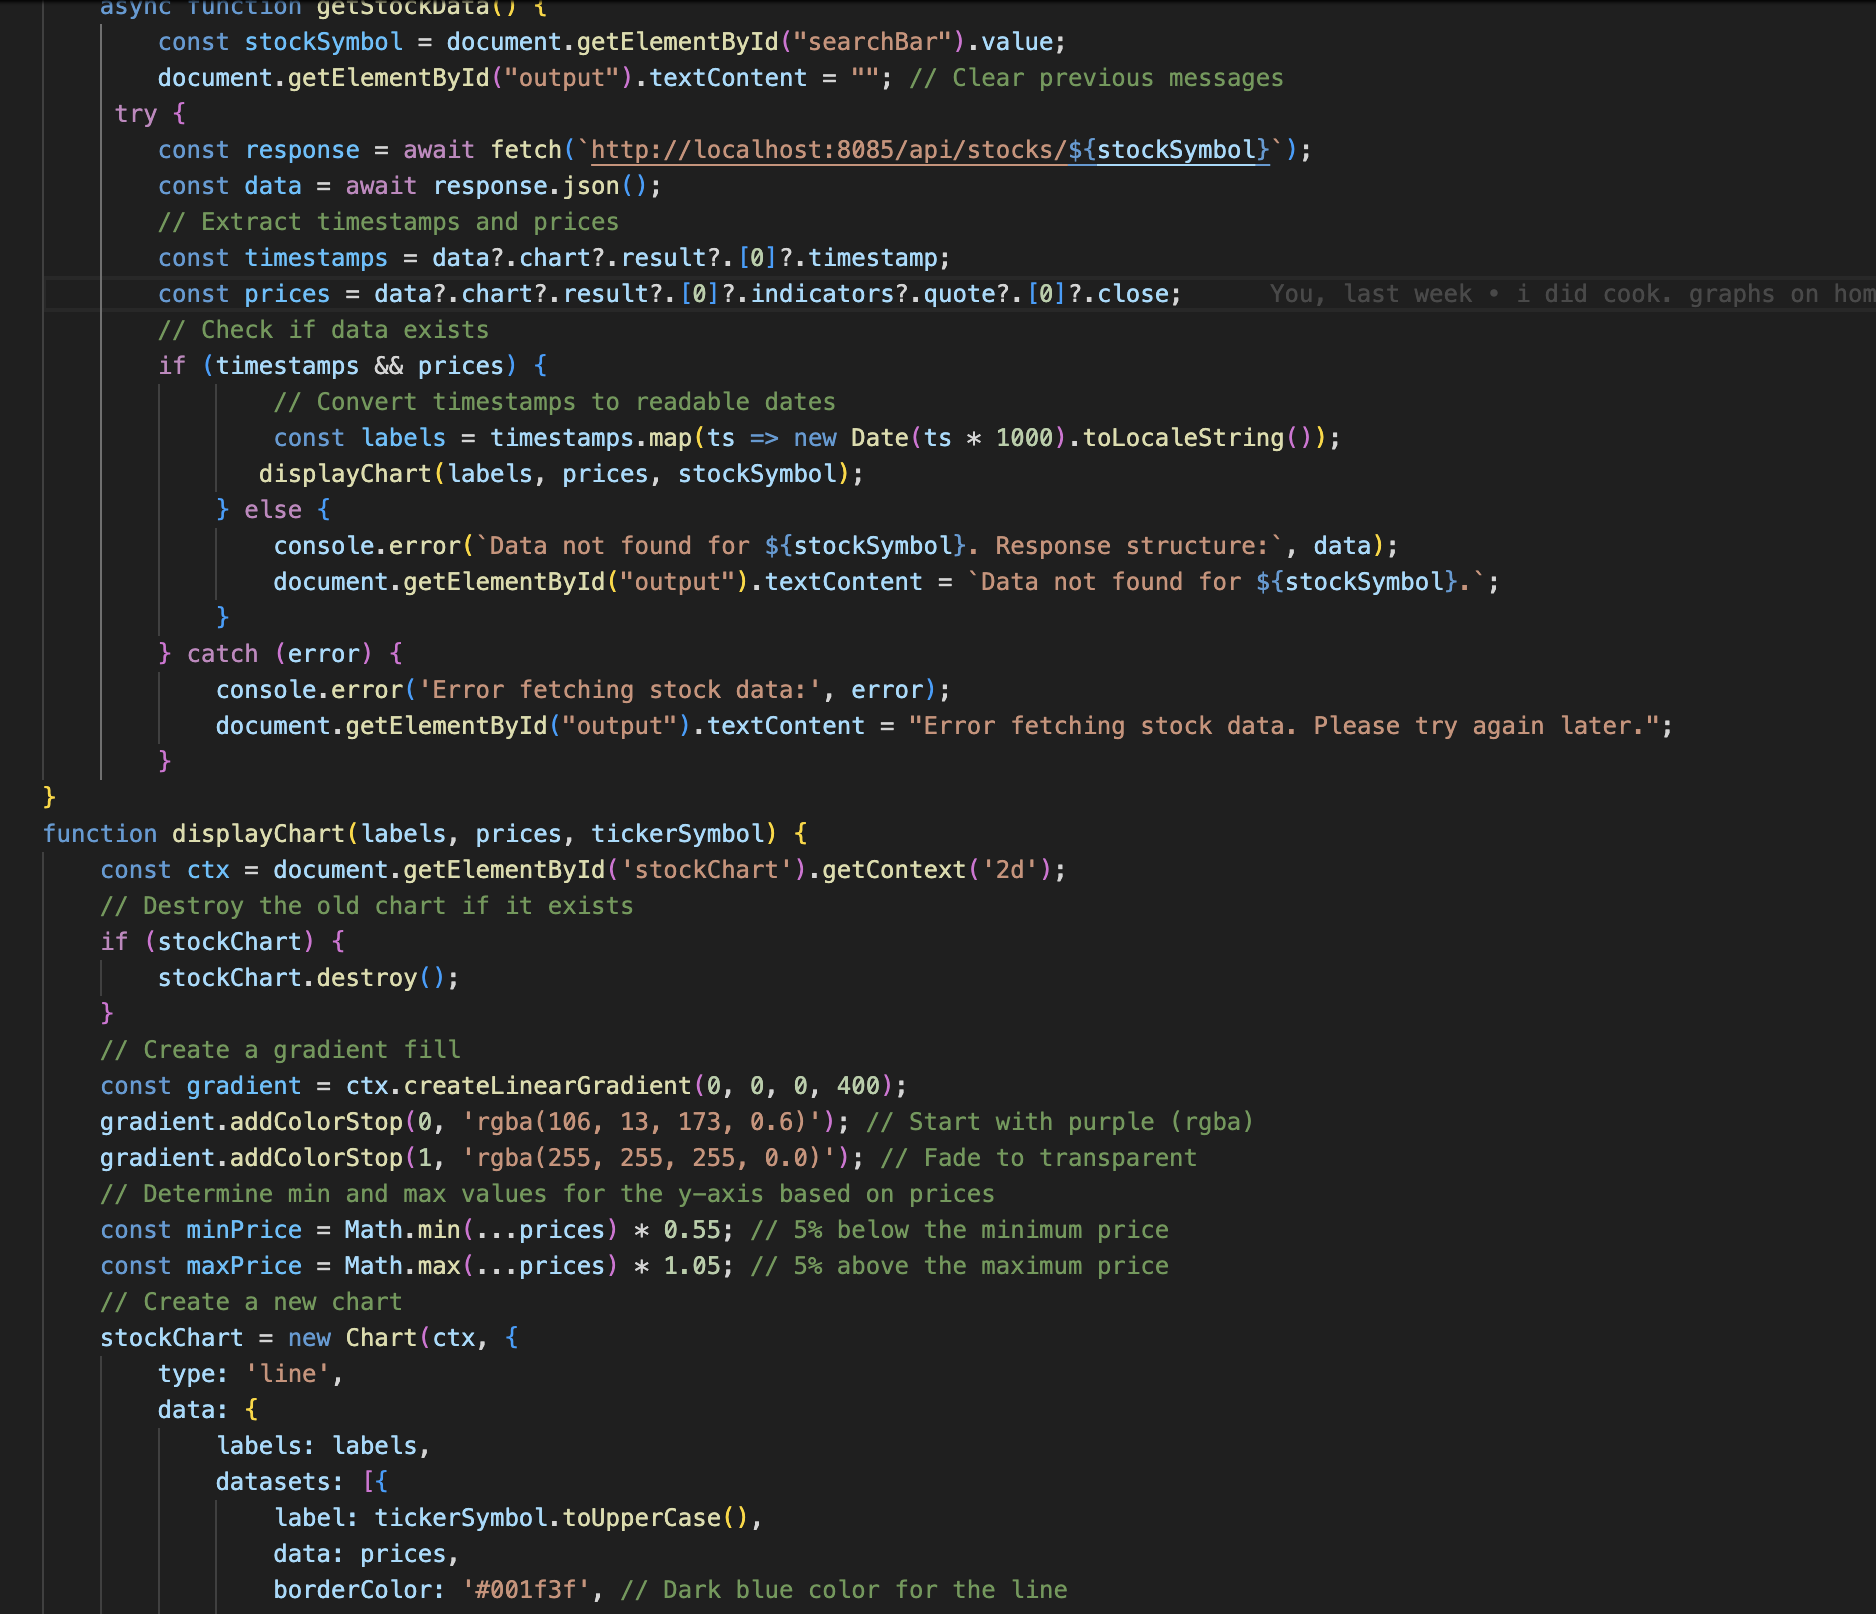
updateGraphics: Handles the dynamic updating and display of graphs and other visual elements within the application. This function ensures that all portfolio charts and stock performance visuals are refreshed based on the latest data.
-
updateStockPrice: Updates the stock prices in the system, keeping all the stock data current and ensuring that users can make informed decisions.
-
getPortfolioPerformance: Calculates and returns the dollar gain, percentage gain, and total value of the user’s portfolio. This function is crucial for providing feedback to users on the success of their investments, helping them track their performance.
-
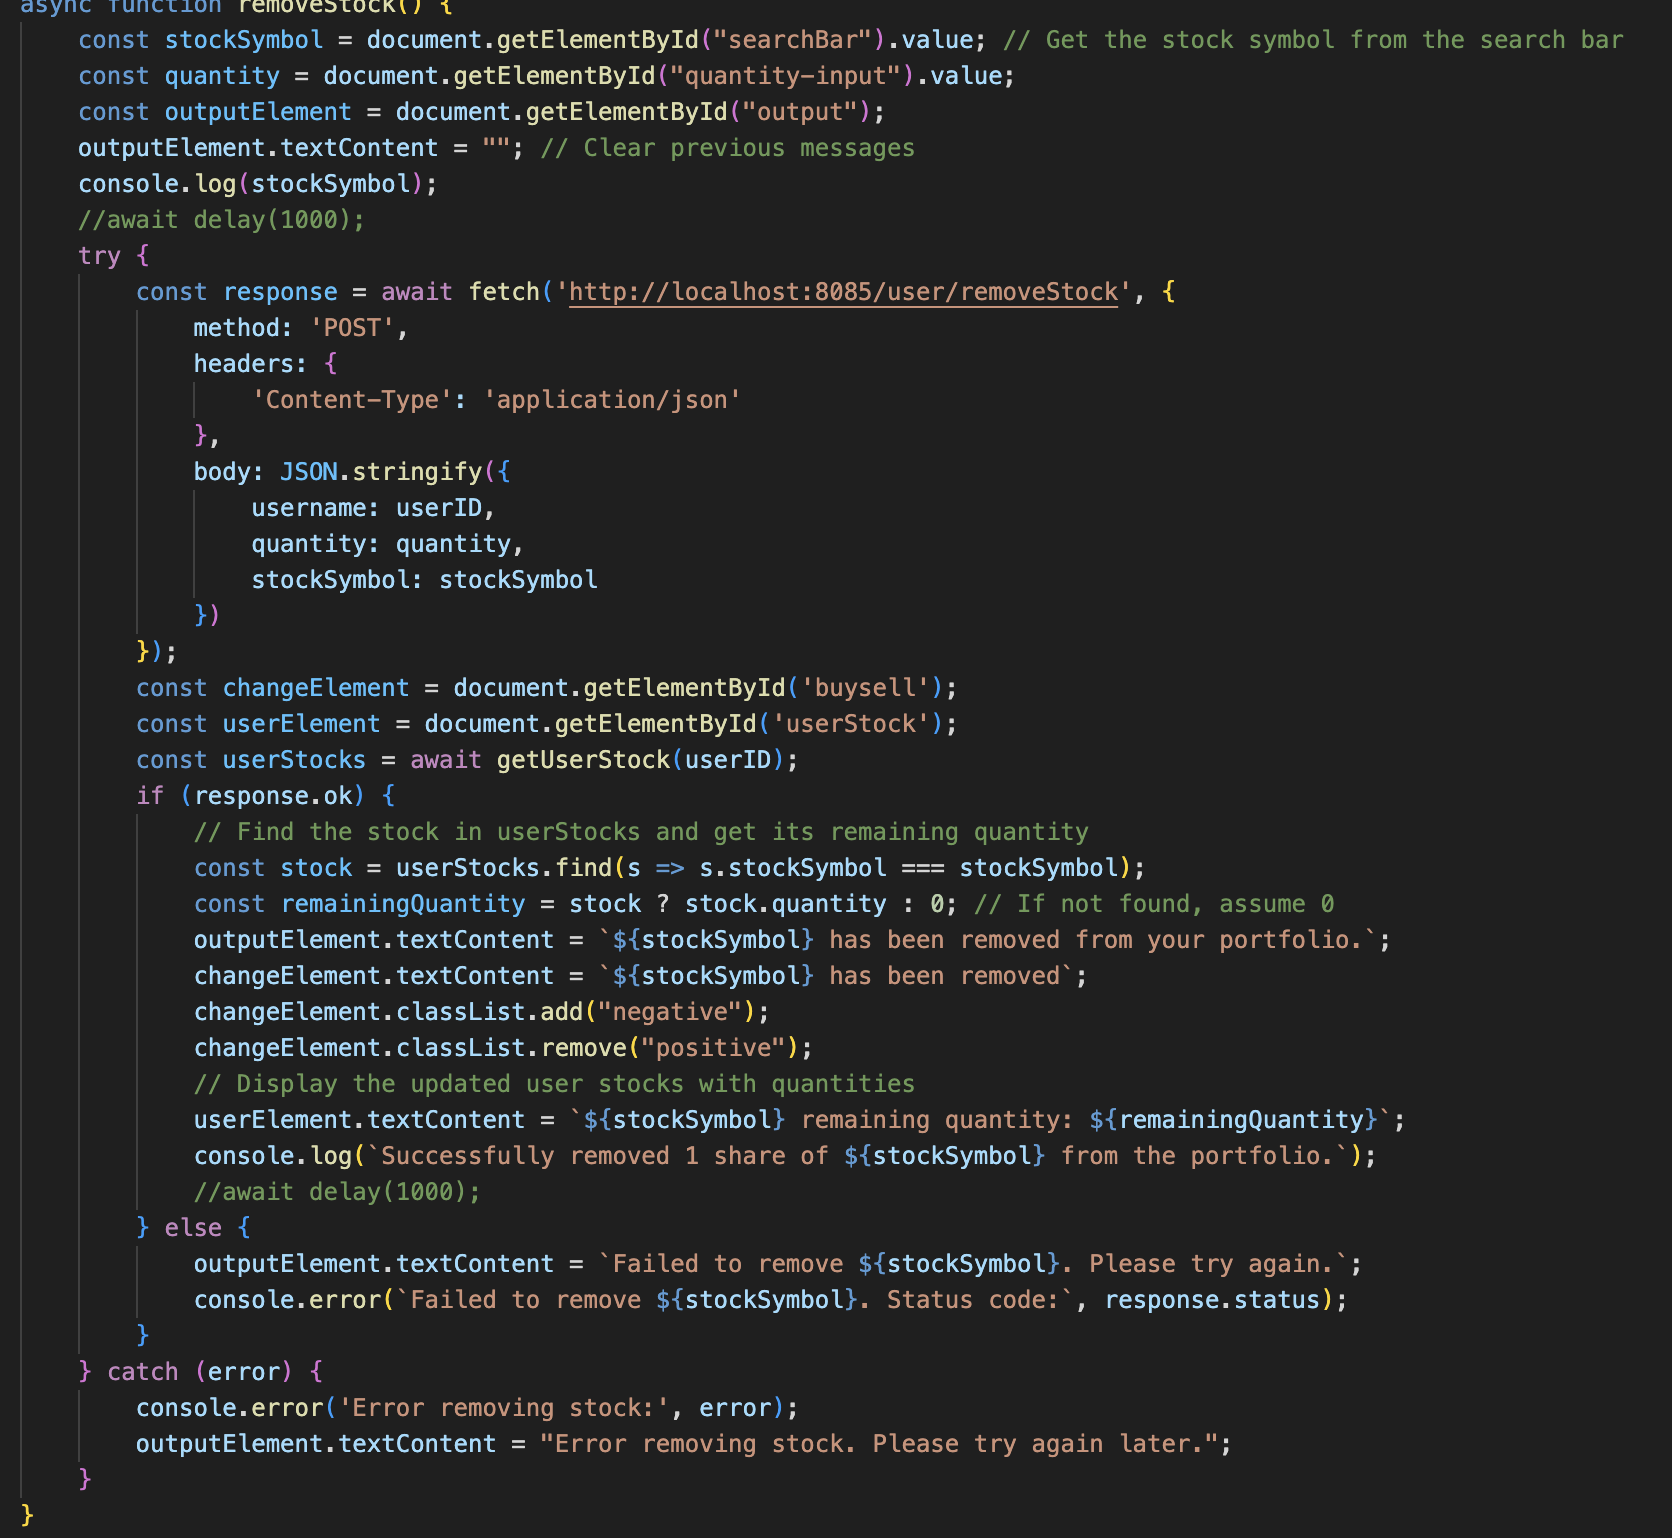
buy/removeStock: Allows the user to buy and sell stocks according to the quantity they have listed. This function is the crux of our entire project. Without it, our project would be utterly useless.
-
This project combines a range of coding skills and technologies to create an interactive, real-time simulation of stock investing. The result is an engaging and educational tool for anyone looking to better understand the stock market.
Frontend Architecture:
The frontend is designed for modularity, with each page functioning independently. Every page contains the necessary functions to operate on its own, ensuring smooth user interaction. This approach allows for easier maintenance and flexibility, as updates to one page won’t directly impact others. The separation of functions ensures a seamless and intuitive experience across all pages.
Backend Architecture:
The backend is centered around the User file and SQLite database, which stores user data such as stock investments and portfolio information. All frontend functions connect to the User model, enabling smooth communication between the frontend and backend. When a user performs an action, the frontend calls the backend functions to retrieve or update data, ensuring real-time updates and secure data management. This structure ensures efficient handling of user data and a responsive application.